
Why is my WordPress site so slow? Most often the cause is the server, an old PHP version, a heavy plugin, large images or a bloated database. Each one leaves a measurable sign.
We ran these checks on a WordPress 7.1.3 test site with the Query Monitor plugin in October 2026. Every threshold and date below comes from the vendor’s own documentation, linked where it appears.
This guide shows how to find the cause in six checks, what counts as slow, and the eight usual suspects with their fixes. It ends with a table that tells you what to fix first and which of our deeper guides to open next.
Why Is My WordPress Site So Slow? Start With Six Checks
When you ask why is my WordPress site so slow, the answer comes from testing in a fixed order. Each check removes a group of suspects, from the server to the page itself. Changing things before you measure only hides the real problem.
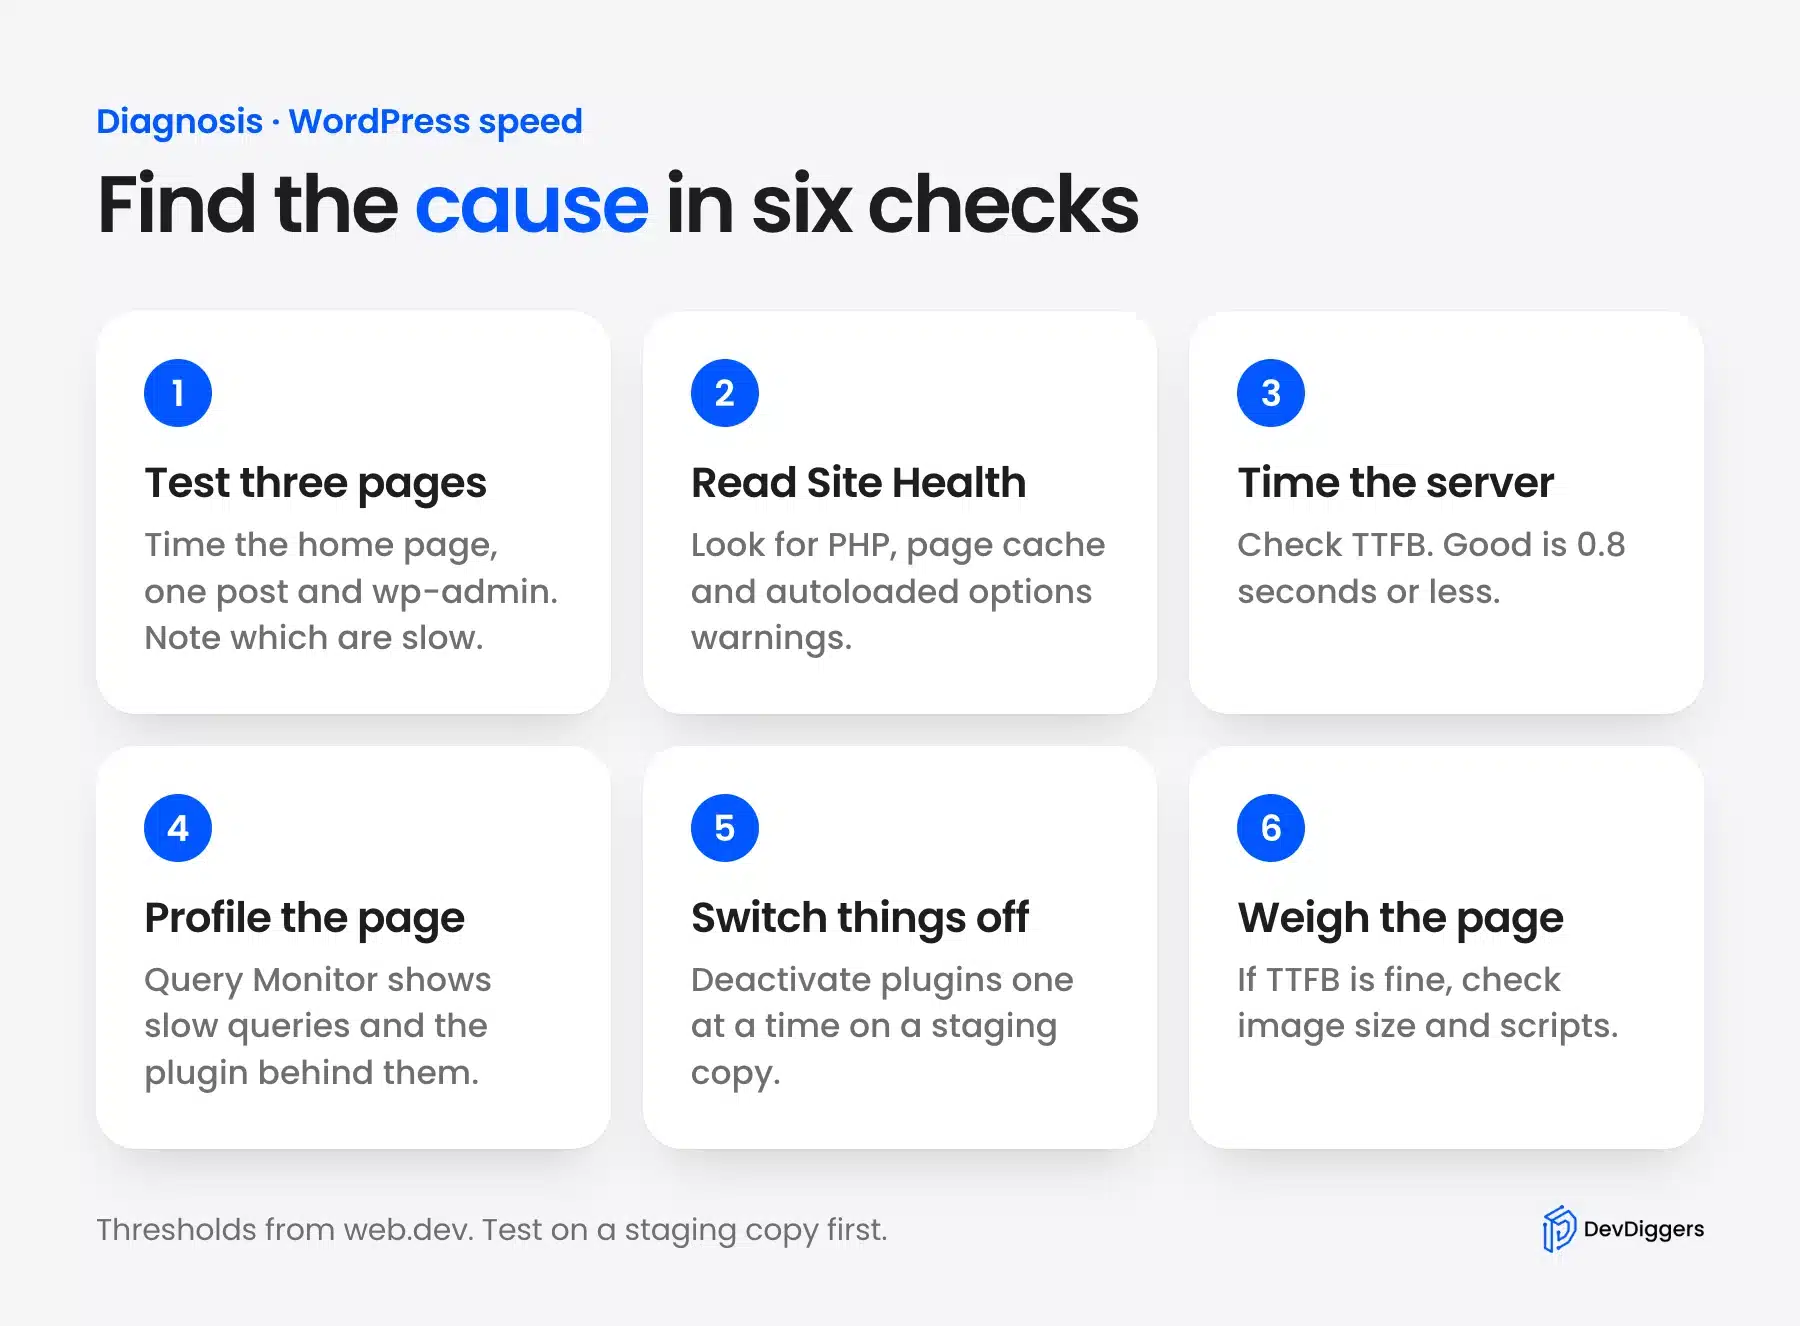
Work through these checks on a staging copy when you can:
- Test three pages: Time the home page, one blog post and the wp-admin dashboard. Note which of the three feels slow.
- Read Site Health: Open Tools > Site Health and read every item marked Performance.
- Time the server: Measure time to first byte (TTFB) with your browser’s network panel or a speed test.
- Profile the page: Install Query Monitor and read its overview for page time, memory and database queries.
- Switch plugins off: Deactivate plugins one at a time and test again after each one.
- Weigh the page: If the server answers fast, check image sizes and the scripts that load after the first byte.
Paste your address into PageSpeed Insights for a quick outside reading and compare it with what you see on your own screens. The first check matters more than it looks. A slow front end with a fast dashboard points at caching, themes or images, and the reverse points at plugins and the database.
A slow WordPress dashboard, a slow WordPress site on the front end and WordPress slow loading in the editor can each have a different cause. If your whole store crawls, our WooCommerce speed guide covers the extra weight that carts and checkout add. For a general walkthrough of fixes, see how to fix slow website loading.
What Counts as a Slow WordPress Site?
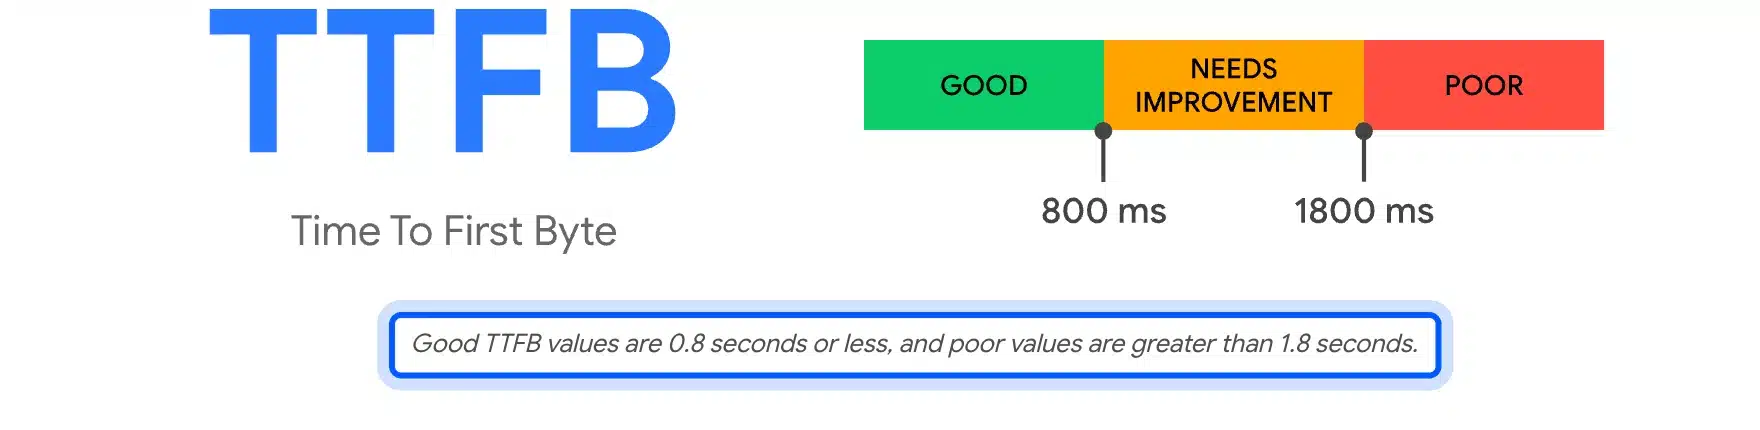
A WordPress site counts as slow when its server needs more than 0.8 seconds to send the first byte. It also counts as slow when the main content takes longer than 2.5 seconds to appear. Google’s web.dev sets both numbers.
The web.dev TTFB guide says good TTFB values are 0.8 seconds or less and poor values are greater than 1.8 seconds. TTFB covers redirects, DNS lookup, the connection handshake and the wait for the first response byte. Our free WordPress speed test reports the median TTFB over three loads, plus caching headers and page weight.
The page experience numbers come from the Core Web Vitals guide. It sets the good targets at 2.5 seconds for Largest Contentful Paint (LCP). It uses 200 milliseconds for Interaction to Next Paint (INP) and 0.1 for Cumulative Layout Shift (CLS).
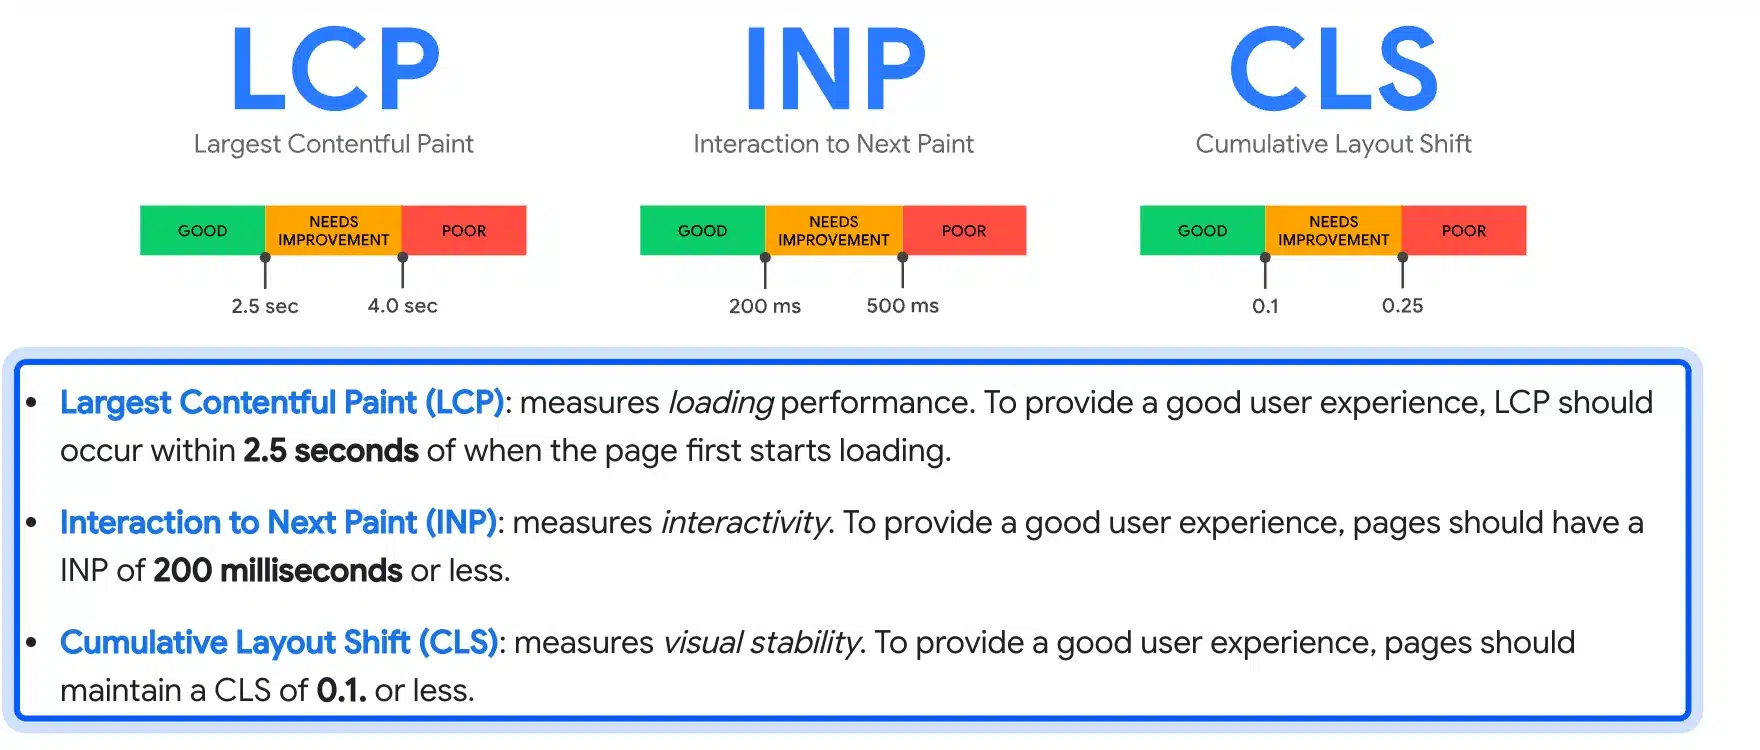
The same guide recommends judging these at the 75th percentile of page loads across mobile and desktop. That means one fast test on your own laptop proves little.
Worth knowing: TTFB is not a Core Web Vitals metric. web.dev says a site can miss the good TTFB number if its other metrics still score well. Treat it as a diagnosis tool.
Slow Server Response and a Missing Page Cache
A slow server response shows up as a long wait before anything appears, and a missing page cache is one frequent reason. Without a cache, PHP and the database rebuild each page for every visitor. Site Health flags both problems in one item.
WordPress Site Health compares your server response with a recommended 600 milliseconds. Our test site has no page cache. Site Health raised a critical issue titled “Page cache is not detected and the server response time is slow”.
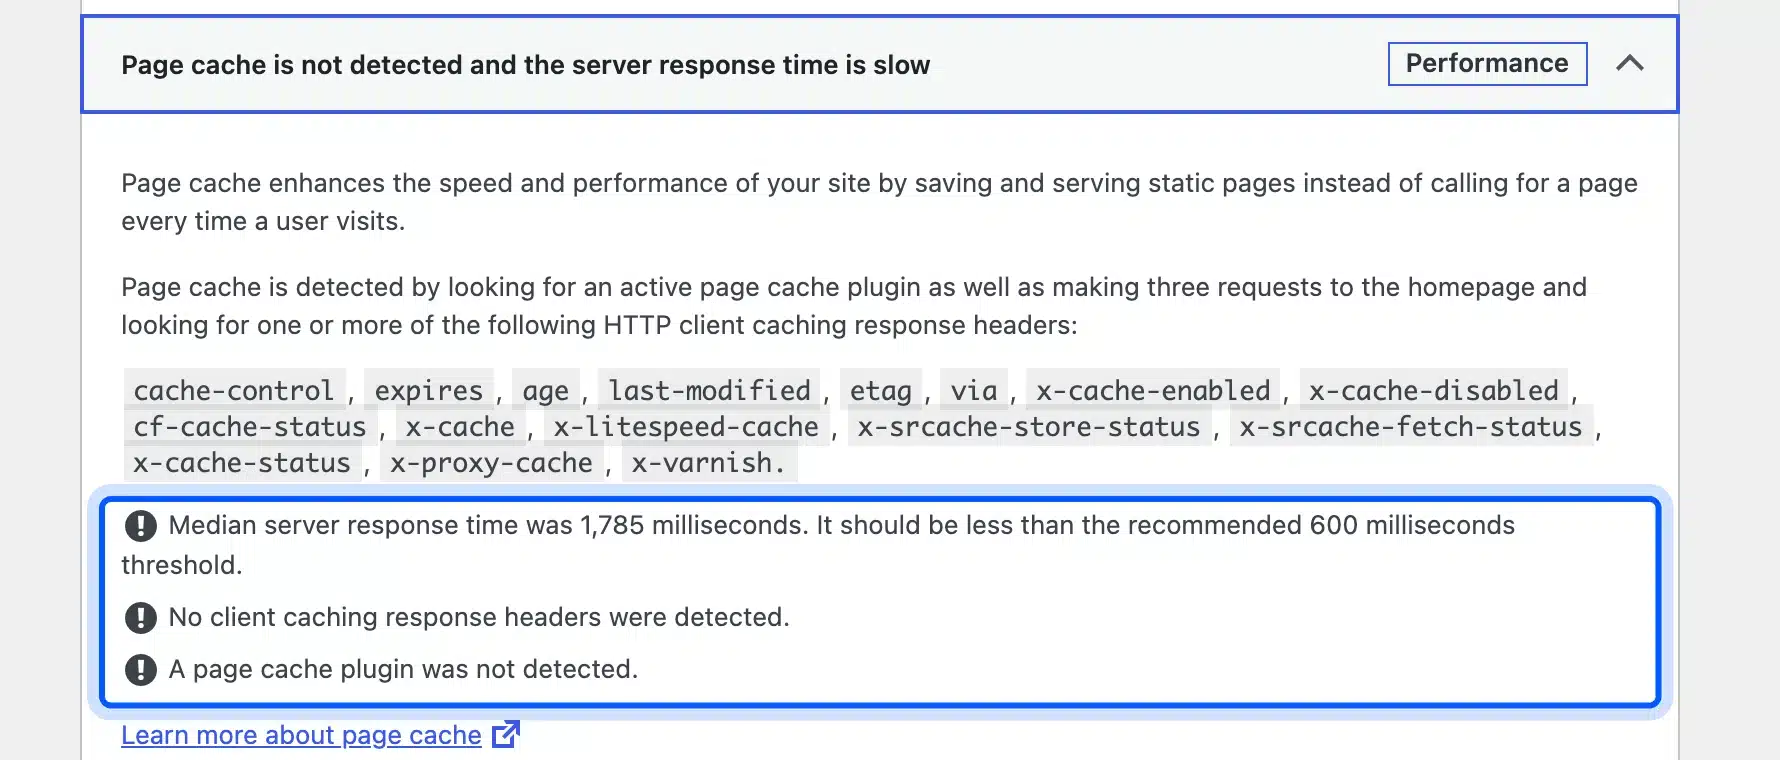
The official WordPress performance guide says caching plugins serve pre-built copies of pages, which lowers server processing load. It also notes that the techniques open to you depend on your hosting setup.
That last point is the catch on cheap shared hosting. A cache cuts the work per visit, but a crowded server can still answer slowly before the cache is even consulted.
To fix it, install one page cache and read our comparison of the best WordPress caching plugins. If TTFB stays above 0.8 seconds with a cache on, follow how to reduce TTFB in WordPress. You can also ask your host about the plan.
An Old PHP Version
An old PHP version puts WordPress on a branch that no longer receives fixes. Newer branches are the ones that stay supported, and the PHP project lists which are. In October 2026, only versions 8.2 to 8.5 appear in that support table.
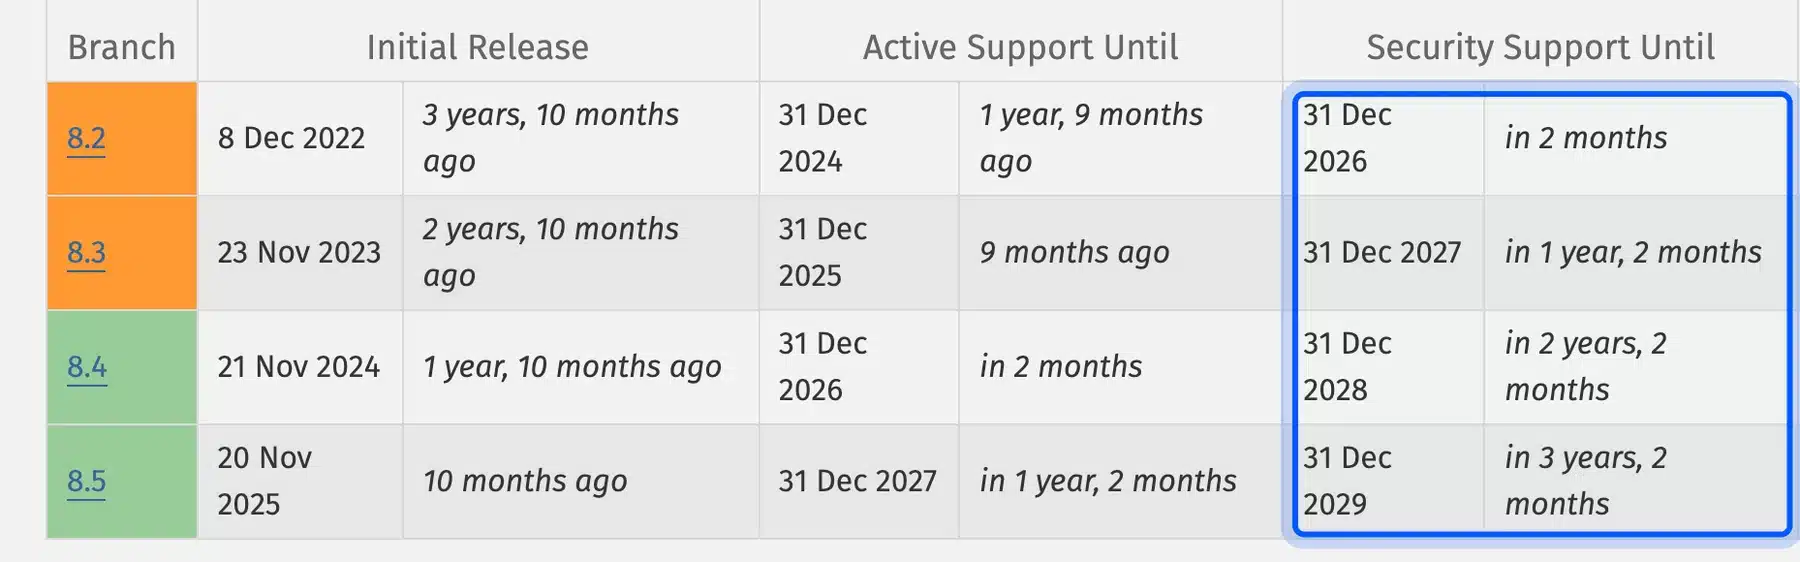
According to php.net’s supported versions page, PHP 8.2 and 8.3 receive security fixes only, until 31 December 2026 and 31 December 2027. Versions 8.4 and 8.5 are still in active support.
WordPress goes further than that table. Its requirements page recommends PHP 8.3 or greater, and MariaDB 10.11 or greater, or MySQL 8.0 or greater.
Check your version under Tools > Site Health > Info > Server and ask your host to move you up one branch at a time. Test on a staging copy first, because an old plugin can break on a newer PHP version.
Too Many Slow Plugins
A plugin slows WordPress when it runs heavy database queries, loads scripts on every page or makes slow calls to outside services. The number of plugins matters less than what each one does. Ten light plugins can cost less than one badly written one.
Query Monitor shows which plugin is responsible. The Query Monitor listing says it flags slow, duplicate or erroneous database queries and groups them by the plugin, theme or function behind them. It had more than 200,000 active installations in October 2026.
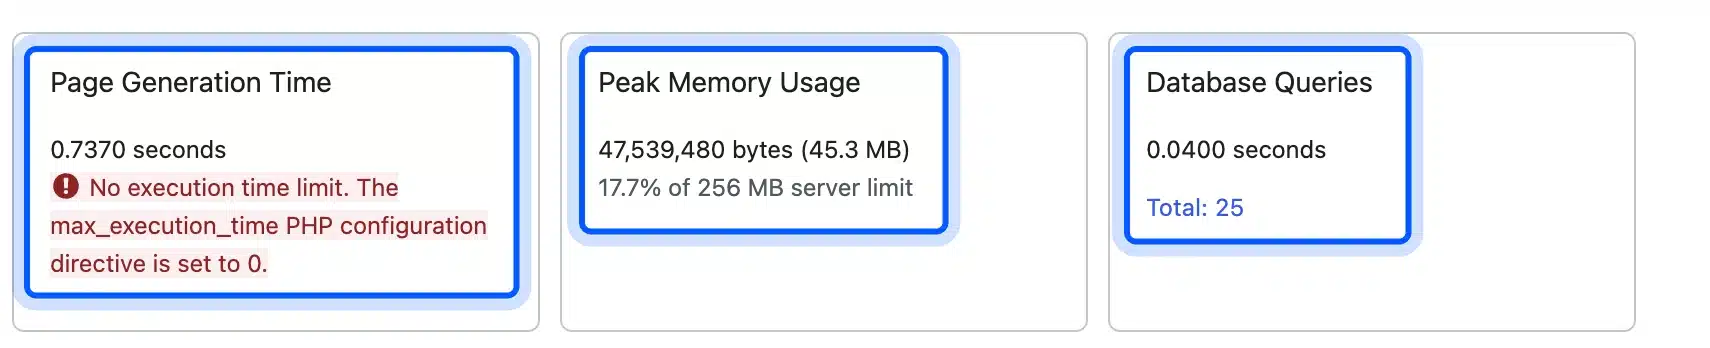
On our test home page, the overview reported 25 database queries and 45.3 MB of peak memory, which was 17.7% of a 256 MB limit. Those are small numbers. On a real site, the same panel is where a single plugin showing hundreds of queries stands out.
Open the Database Queries panel and group the queries by component to see the plugin names. Then deactivate the worst one on staging and test again.
Our guide to checking for plugin conflicts on WordPress shows the safe order. The post on whether 50 plugins are too many explains why the count alone is the wrong test.
A Heavy Theme or Page Builder
A heavy theme slows a site by loading large style files, scripts and fonts on every page, whether the page needs them or not. A page builder can add layers of markup on top. The effect shows up as a late LCP even when the server answers fast.
You can test this without guessing. On a staging copy, switch to a default theme such as Twenty Twenty-Five, load the same page and compare the LCP and total page size. If the numbers drop sharply, the theme is the cause.
For a store, the theme choice also changes cart and checkout speed. Our list of the fastest WooCommerce themes is a good starting point if you need to switch.
Fonts and icon libraries deserve a look too. A theme that loads five font weights and a full icon set asks the browser for files the page never shows. Open the network panel, filter by fonts and styles, and count what loads before the main content. Our guide to reducing HTTP requests in WordPress shows how to cut those files.
Tip: Do the theme test with caching switched off for that one run. A cache can hide the theme’s real cost and make two very different themes look the same.
Large Images and Heavy Pages
Large images slow a page because the browser must download every byte before it can finish drawing the layout. A photo straight from a phone can be several megabytes. The fix is the right size, the right format and the right compression for each image.
The WordPress performance guide says to make sure all image files are optimized and to consider newer formats that produce smaller files. Make it a rule for every upload instead of a one-time clean-up.
Start with the biggest images on your slowest page. Resize them to the width the layout shows and compress them. Our guide to WordPress image optimization walks through formats, sizes and tools.
Check the format and the dimensions together. A 4,000 pixel wide original in a 700 pixel column is a sign to resize before upload. Compare the file size in the Media Library with the size on screen before you pick a tool.
If TTFB is already good, images are the first place to look. A page whose HTML arrives in 0.4 seconds but whose hero image takes 4 seconds will still fail the 2.5 second LCP target.
A Bloated Database and Autoloaded Options
A bloated database slows WordPress because some data loads on every request. Autoloaded options are settings that WordPress reads on every page load. A plugin that stores a large value there adds to every visit, in the dashboard and on the front end.
WordPress 6.6 added a Site Health check for this. The core announcement says it shows a critical issue titled “Autoloaded options could affect performance” when the total size of autoloaded options exceeds 800 KB.
We tested it. We stored a 1 MB value as an autoloaded option on our test site, and Site Health raised that exact critical issue. It reported 122 autoloaded options with a size of 1 MB.
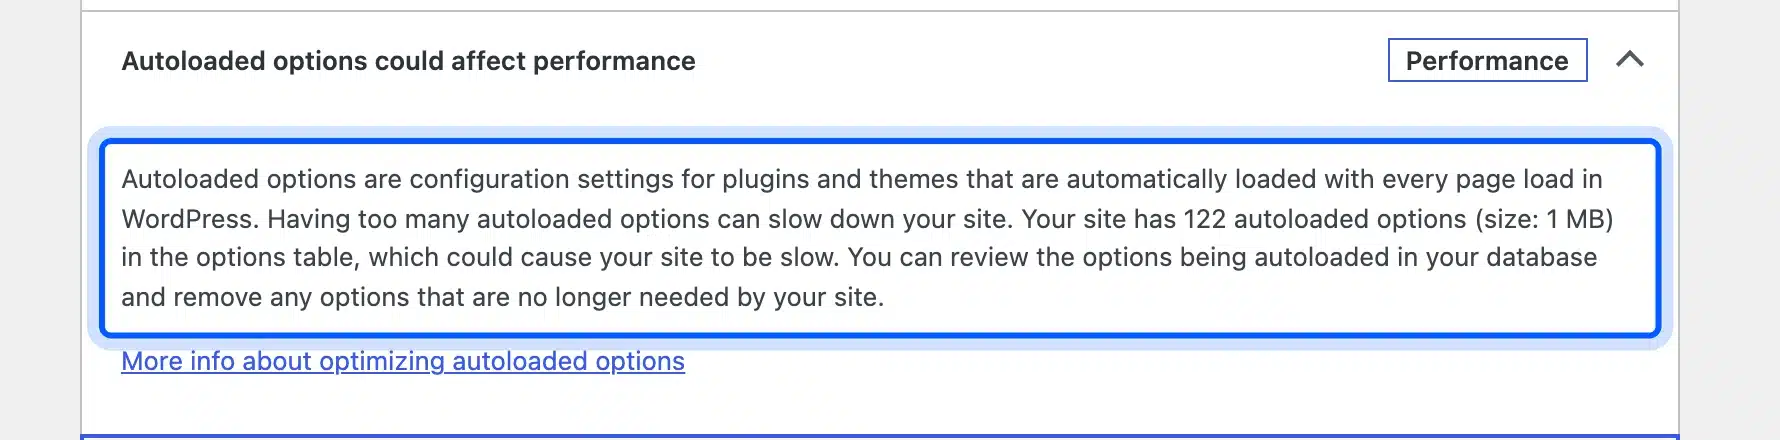
The usual sources are plugins that were removed but left their data behind, and plugins that cache large arrays in options. Back up the database first. Then find the largest autoloaded rows and delete the ones that belong to plugins you no longer use.
Our guide on how to clean up a WordPress site covers revisions, transients and leftover tables in the same safe order.
Background Tasks Like WP-Cron
Background tasks slow a site when scheduled jobs run during page requests and compete with visitors for the same server. WP-Cron is WordPress’s built-in scheduler, and it checks for due jobs on page loads. A late or crowded schedule can add to response time.
Site Health can warn you here too. It raises “A scheduled event is late” when a job has missed its time.
That hints at a stuck or overloaded scheduler. It does not prove that cron is your main problem.
If your host offers a real server cron job, you can move scheduled tasks there and turn off the page-load trigger. Our guide on how to disable WP-Cron in WordPress explains the change and the cron line that replaces it.
Look at which plugins register scheduled jobs, such as backup, email queue and import tools. A job that runs every minute costs the server more than one that runs once a day. Fewer jobs leave more room for visitors.
If a plugin lets you choose how often it syncs or sends, pick the longest gap you can live with.
Do this only if you can set up the replacement. Without a working server cron, scheduled posts, backups and subscription renewals stop running.
Slow Calls to Outside Services
A page slows down when it waits on a request to another server, such as a license check, a font host or a social feed. WordPress holds the page until the answer returns or the request times out. Query Monitor lists each outside request with its time.
The Query Monitor listing says each HTTP API request shows its response code, the component that made it and the time taken. That last field names the plugin or theme to blame.
On our test home page, the HTTP API Calls card read “None”, which is what you want to see. A plugin that phones home on every page load would appear there with its own time.
Chat widgets, ad scripts and embedded feeds each add requests of their own. Test the page with one switched off at a time, and keep only what earns its cost.
Why Is the WordPress Admin Slow When the Front End Is Fast?
A WordPress admin slow while the public site is fast usually points to plugins, the database or the Heartbeat API. Page caches serve static pages to visitors and do little for logged-in screens. Run Query Monitor on the dashboard itself instead of a public page.
Heartbeat is the other suspect. The Heartbeat API documentation describes it as a server polling API built into WordPress, with a tick that runs every 15 to 120 seconds. Each open admin tab can send requests of its own.
Open one admin tab rather than five and see whether the dashboard speeds up. Then run Query Monitor on the slow screen and look at queries by component. A slow dashboard from one plugin’s settings page is common, and Query Monitor will name it.
Large post editors are another case. A page with many blocks, revisions and plugin panels takes longer to load. Test the editor with plugins off before blaming the server.
What to Fix First
Fix the cause with the largest measured effect first. That is usually the server response, followed by PHP and then plugins and images. Changing one thing at a time lets you see what helped. The table below maps what you see to the first check and the fix.
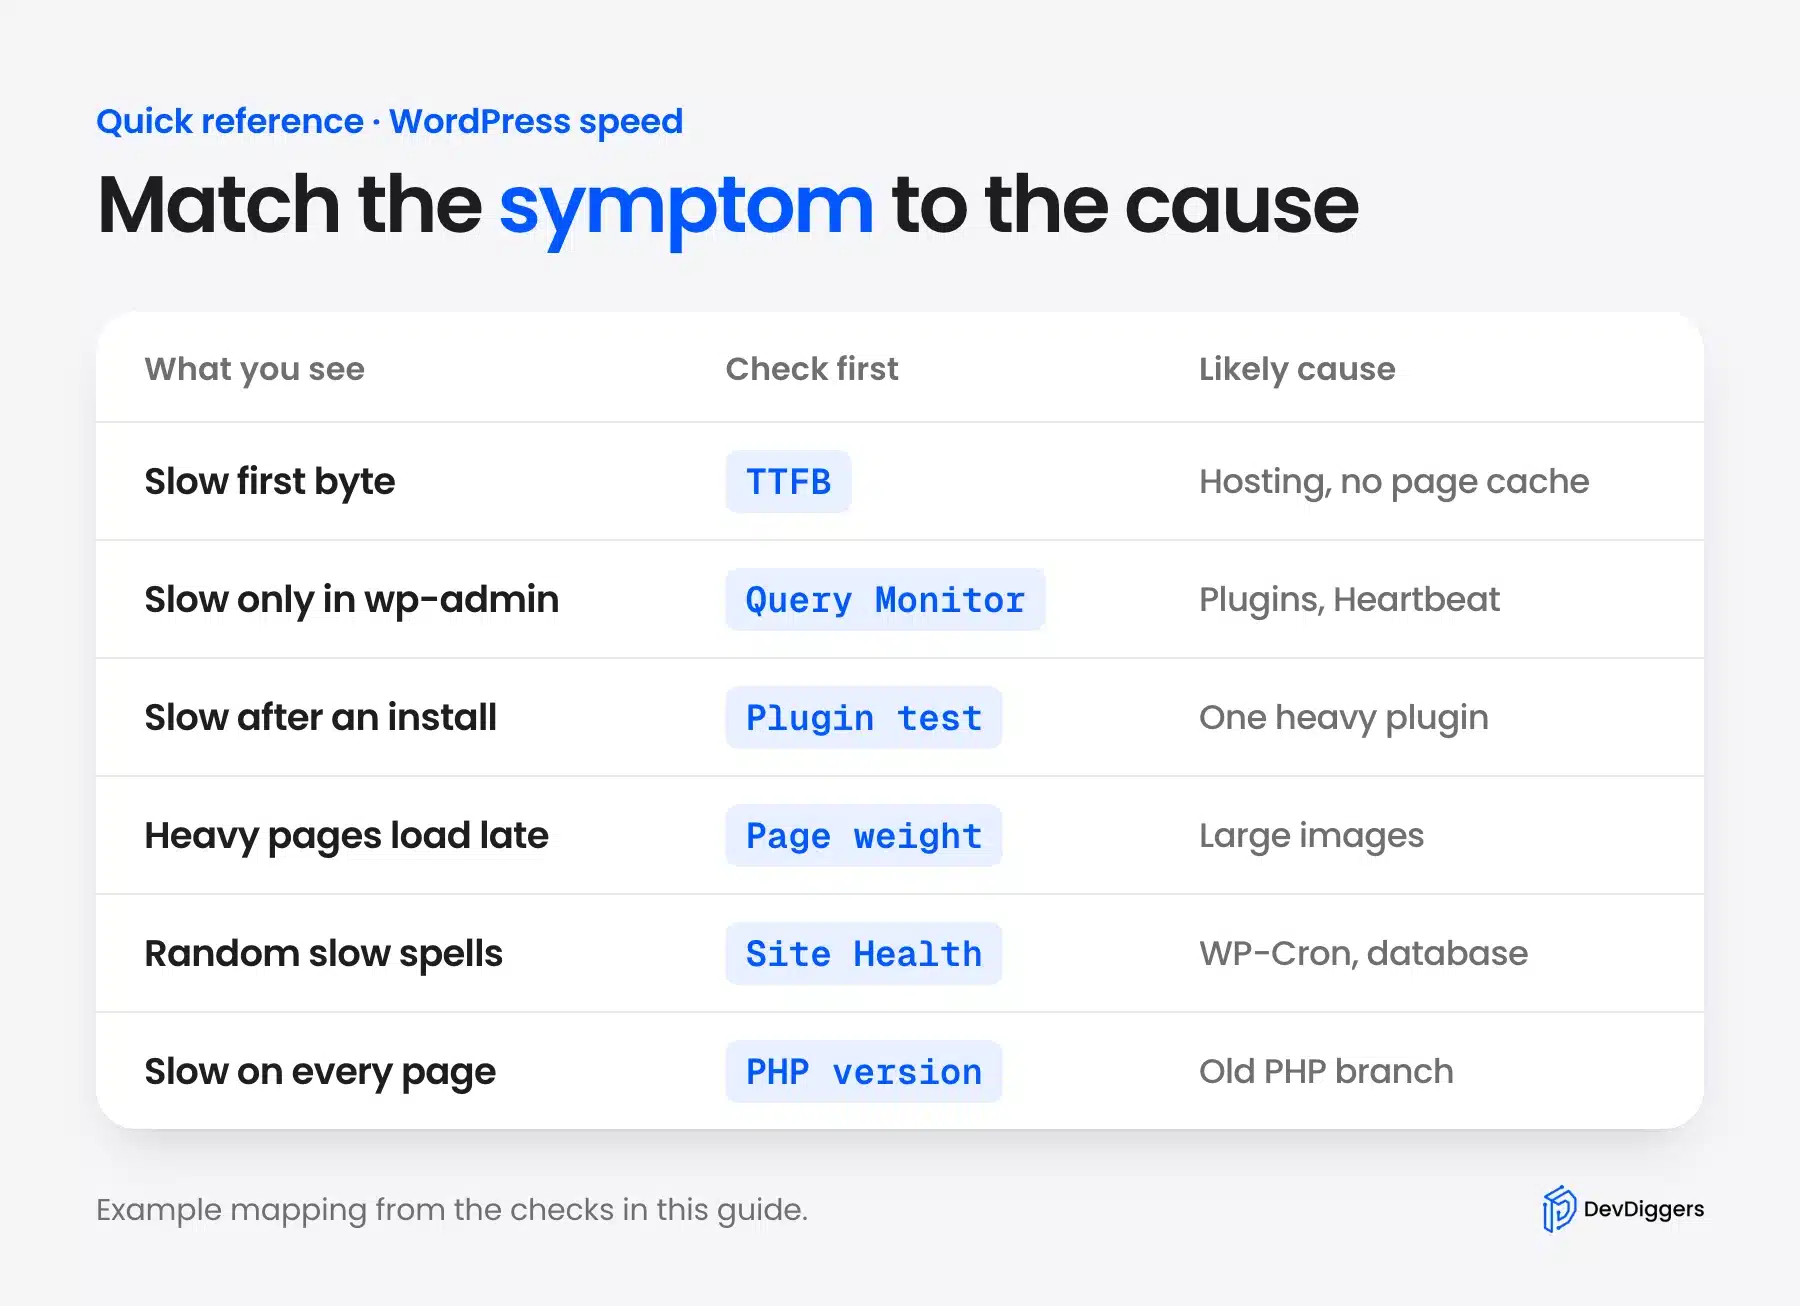
| What you see | Check first | Likely fix | Read next |
|---|---|---|---|
| Slow first byte | TTFB and Site Health | Page cache or a better hosting plan | TTFB guide |
| Slow only in wp-admin | Query Monitor | Remove or replace one plugin | Plugin conflicts |
| Late main image | Page weight | Resize and compress images | Image guide |
| Site Health autoload warning | Options table | Delete leftover plugin data | Site clean-up |
| Slow store but normal blog | Cart and checkout | Trim cart plugins and scripts | WooCommerce speed |
If you work through the checks and the numbers still look wrong, the cause is often a mix of several small ones. Our team can audit it for you through our WordPress speed optimization services.
Conclusion
If you still ask why is my WordPress site so slow, measure first. Compare three pages, read Site Health, time the server and profile the page with Query Monitor. Those four checks narrow most cases to one cause.
Fix in order of effect: server response and caching, a supported PHP version, the heaviest plugin, oversized images and the autoloaded options in your database. Change one thing, test again and keep notes.
Use the table above to pick your next guide. When the cause is a mix that you cannot untangle, a speed audit saves more time than another round of guessing.
Frequently Asked Questions (FAQs)
Q1. Is WordPress naturally slower than other website platforms?
No. A fresh WordPress install is light, and slowness comes from hosting, plugins, themes and content added later, as the WordPress performance guide describes. On our test site, with one plugin, the home page generated in well under one second.
Q2. How do I know if my hosting is causing my WordPress site to be slow?
Test TTFB on a plain page with a default theme and plugins off. If it stays above 0.8 seconds, suspect the server or plan. The web.dev guide rates anything above 0.8 seconds as not good. Site Health’s 600 millisecond response check gives a second reading.
Q3. Can too many WordPress plugins slow down my site?
Yes, but the count is a poor test. One plugin with heavy queries can cost more than twenty light ones. Use Query Monitor to see each plugin’s queries and time. Then remove the worst one first.
Q4. Does updating WordPress core, themes and plugins improve speed?
Sometimes. Updates can fix slow code, and a supported PHP version matters most. Update on a staging copy first, because a new release can also introduce a slow query.
Q5. What is a realistic load time target for a WordPress site?
Aim for the Google targets: TTFB of 0.8 seconds or less, LCP of 2.5 seconds or less and INP of 200 milliseconds or less. web.dev recommends measuring at the 75th percentile of real visits.
Q6. Why did my WordPress site get slower after a recent update?
Something in the update changed load. Deactivate the updated plugin or theme on staging and test again. Then compare Query Monitor’s query counts before and after. Our guide to plugin conflicts shows the safe order.
Q7. Does a CDN help with WordPress speed?
A CDN serves images, styles and scripts from servers closer to the visitor, which helps load times for distant readers. It cannot fix a slow PHP response from your own server. Fix TTFB first.