
Learning how to reduce bounce rate in eCommerce starts with one fact: GA4 counts a session as a bounce when it was not engaged. The fix is to give shoppers a reason to stay past 10 seconds, view a second page or reach a key event.
We checked Google’s GA4 Help pages and Baymard’s cart research in October 2026. We then tested the fixes below on a WooCommerce 11.2.0 test store running WordPress 7.1.3. Two of them run DevDiggers plugins in their Pro builds.
Below you get the GA4 definition, the steps to find your bounce rate and a way to judge your own number. After that come eight fixes and a method to test each one.
What Is Bounce Rate in GA4 and How Is It Calculated?
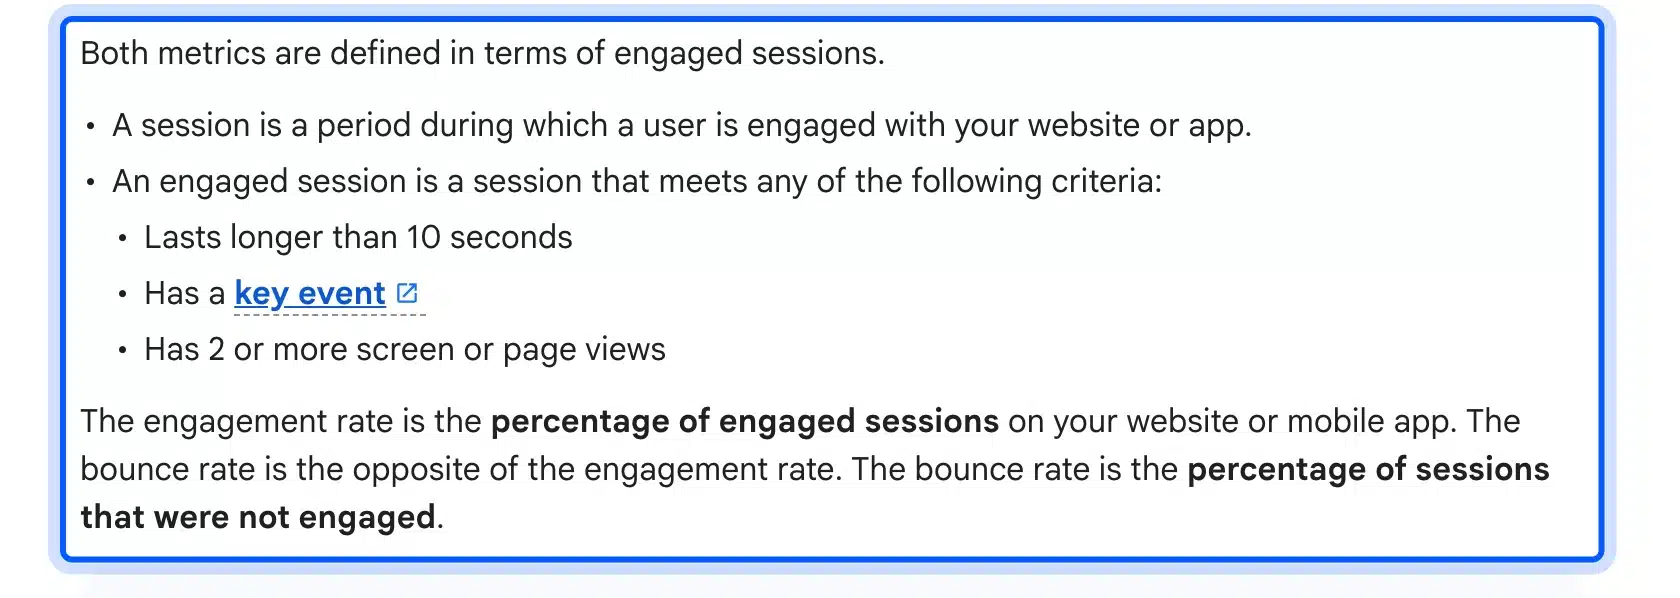
Bounce rate in GA4 is the percentage of sessions that were not engaged. A session counts as engaged when it lasts longer than 10 seconds, has a key event or has two or more page views. Bounce rate equals 100 percent minus engagement rate.
Google states the rule on its own Help page. Google Analytics Help says “The bounce rate is the percentage of sessions that were not engaged.” Any one of the three engaged tests is enough.
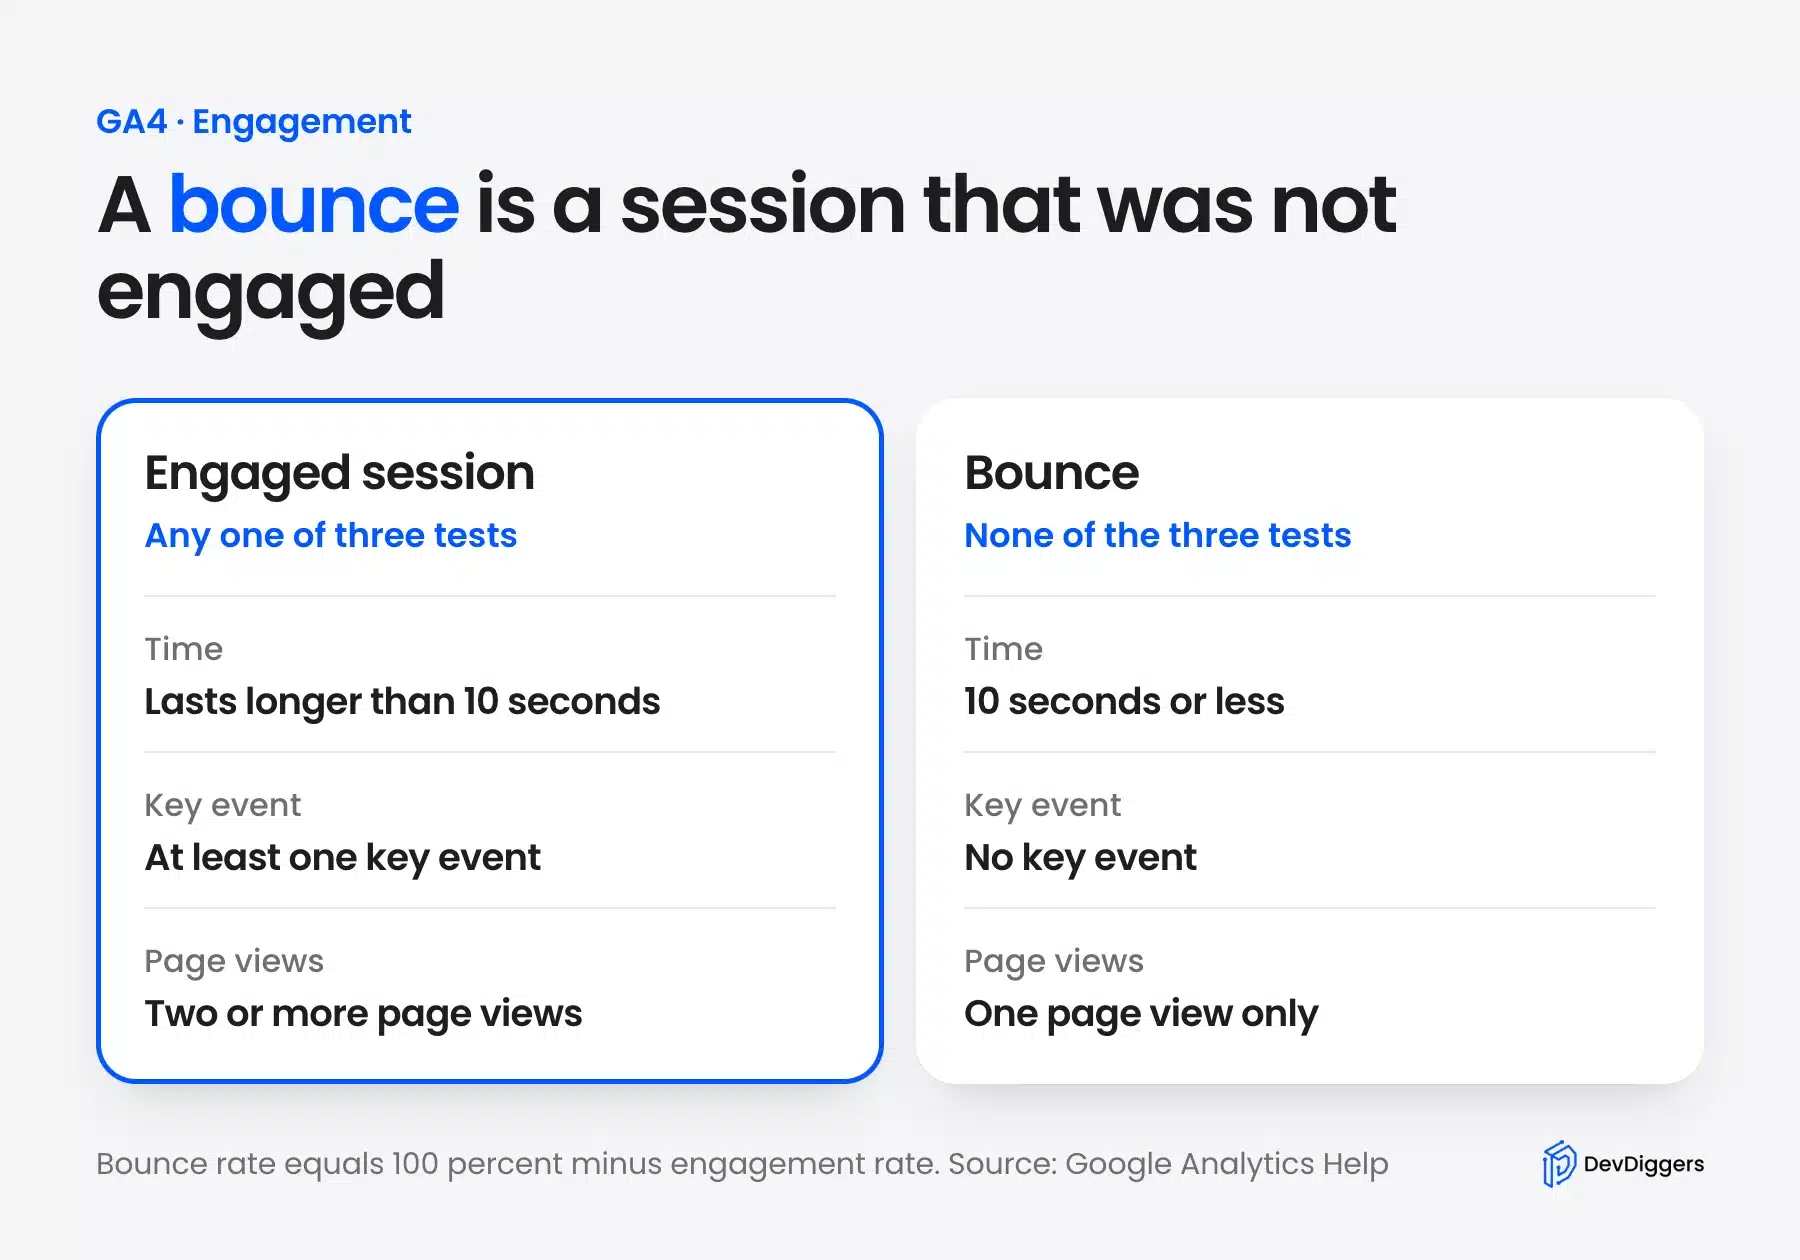
This differs from the old Universal Analytics number. Google’s legacy page says “Bounce rate is single-page sessions divided by all sessions.” Under that rule a shopper who read one product page for two minutes was a bounce.
In GA4 that same visit is engaged. Reports from the two tools measure different things. Never compare a GA4 figure with an old Universal Analytics figure.
Here is a worked example with round numbers. Say 2,000 sessions land on one product page and 1,100 are engaged. Engagement rate is 1,100 divided by 2,000 or 55 percent.
Bounce rate is the other 45 percent. That is 900 sessions.
Note: The 10 second timer can change. In a web data stream the setting is called “Adjust timer for engaged sessions” on Google’s sessions page. A store that moves the timer cannot compare its new bounce rate with the old one.
How to Find Bounce Rate in GA4
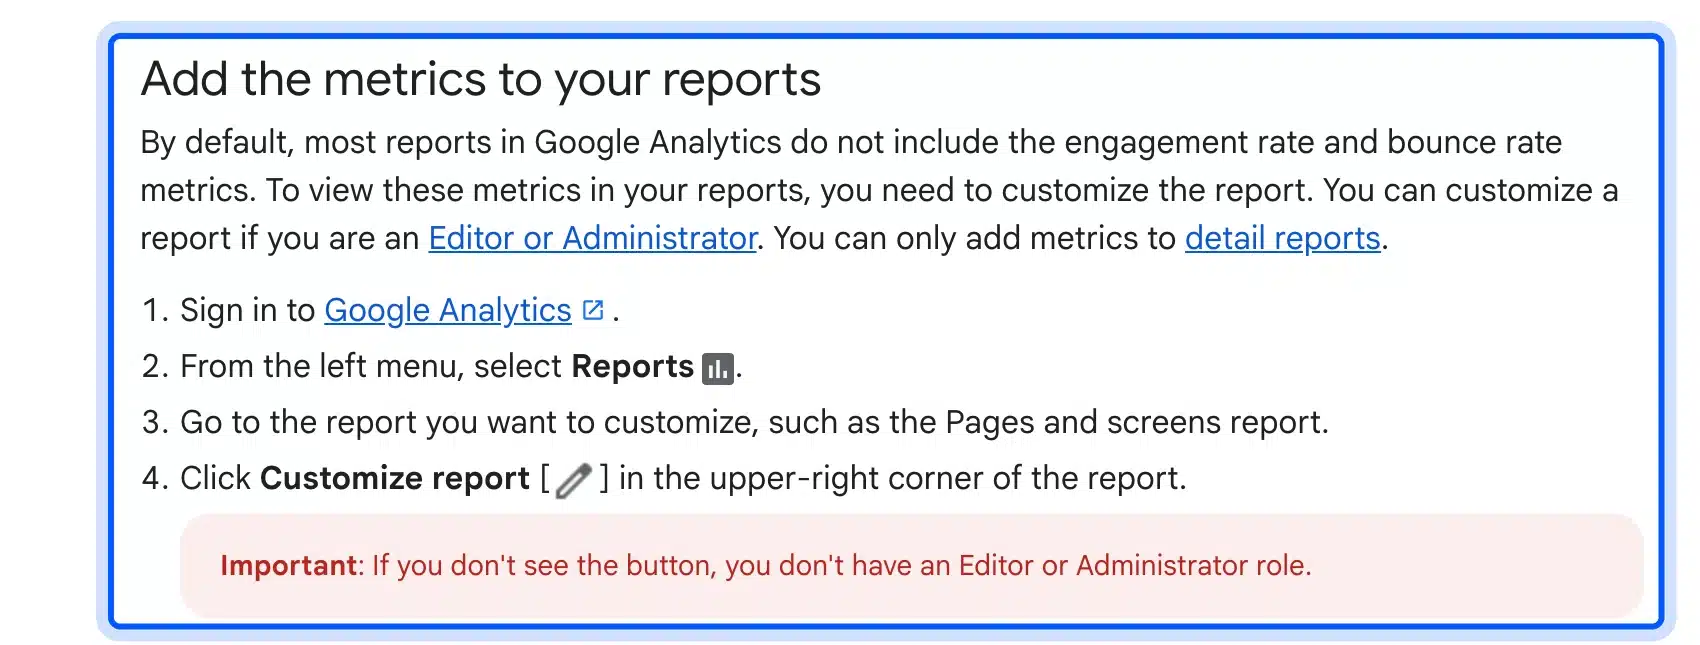
GA4 leaves bounce rate out of most reports by default. To add it, open a detail report such as Pages and screens, click Customize report, add the Bounce rate metric and save. You need the Editor or Administrator role to do this.
Google lists the steps on the same Help page. It says “By default, most reports in Google Analytics do not include the engagement rate and bounce rate metrics.” Follow the steps in this order:
- Open a detail report: Go to Reports in the left menu and open Pages and screens. Overview reports do not accept new metrics.
- Click Customize report: The button sits in the upper right corner. It stays hidden without the Editor or Administrator role.
- Add the metric: Under Report data, click Metrics and then Add metric. Type “Bounce rate” and pick it.
- Apply and save: Click Apply and save the changes to the report.
Pages and screens covers every page a visitor views. For entry pages only, open the Landing page report under Reports > Engagement. Add the same metric there.
Our guide on adding Google Analytics to WordPress covers the tag setup if GA4 is not running yet.
What Is a Good Bounce Rate for an eCommerce Store?
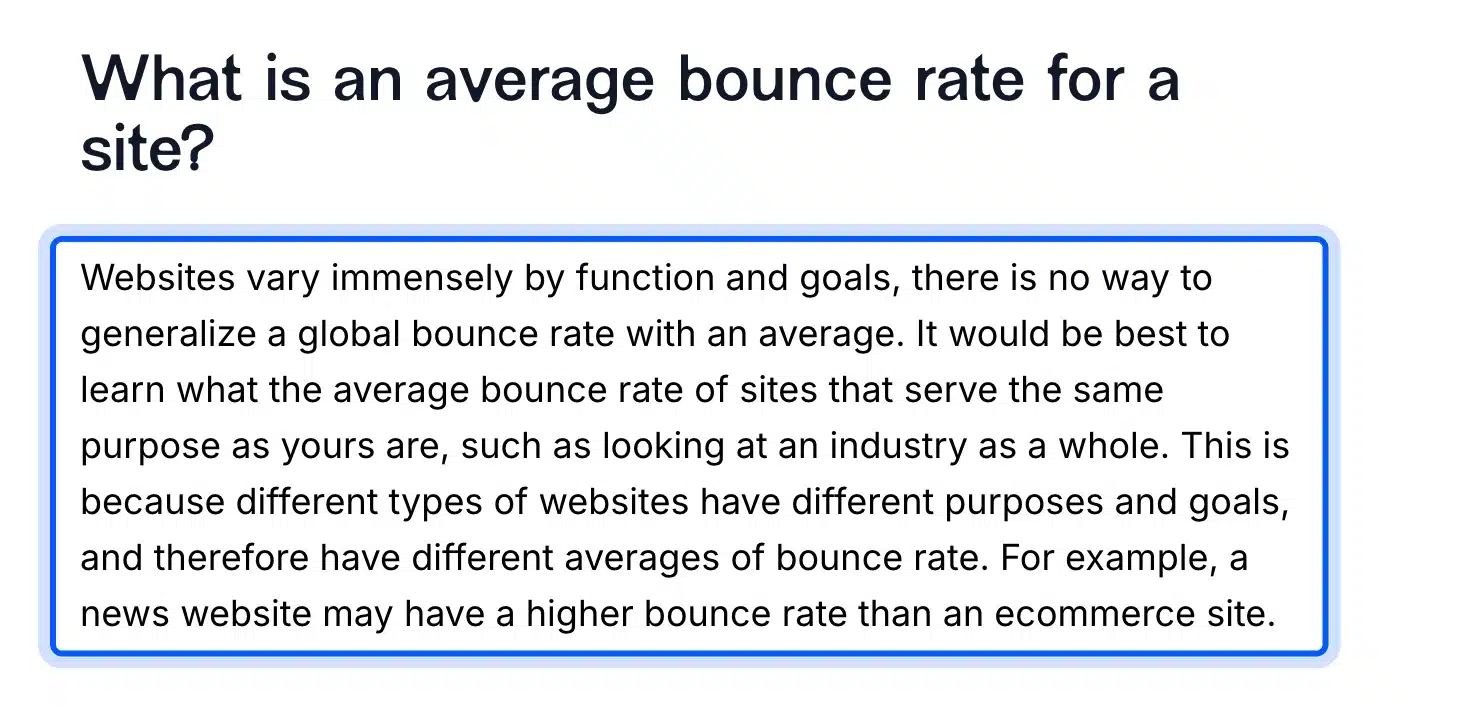
No single number is good for every store. Contentsquare’s benchmark data gave a 47 percent average for eCommerce sites, yet its article says no global average can be generalized. A good bounce rate is one below your own comparable pages.
The Contentsquare article was published in December 2020 and last updated in October 2023. Contentsquare writes “Websites vary immensely by function and goals, there is no way to generalize a global bounce rate with an average.”
Treat any list of ideal numbers with care. Check which analytics tool and which definition it used. A number built on single-page sessions does not match GA4.
A high bounce rate is relative too. A page is high when it sits far above other pages of the same kind on your own site. A blog post at 70 percent and a product page at 70 percent tell different stories.
Which Pages Need Fixing First
Fix the pages where a bounce costs money first. These are product and category pages that receive paid or search traffic. Cart and checkout pages come next because a shopper there has already chosen a product and may be close to buying.
Sort your landing pages by sessions in GA4. Look at the top 10 and compare each bounce rate with the site average. A busy page far above that average is your first target.
The table below shows how the same bounce rate means different things by page type.
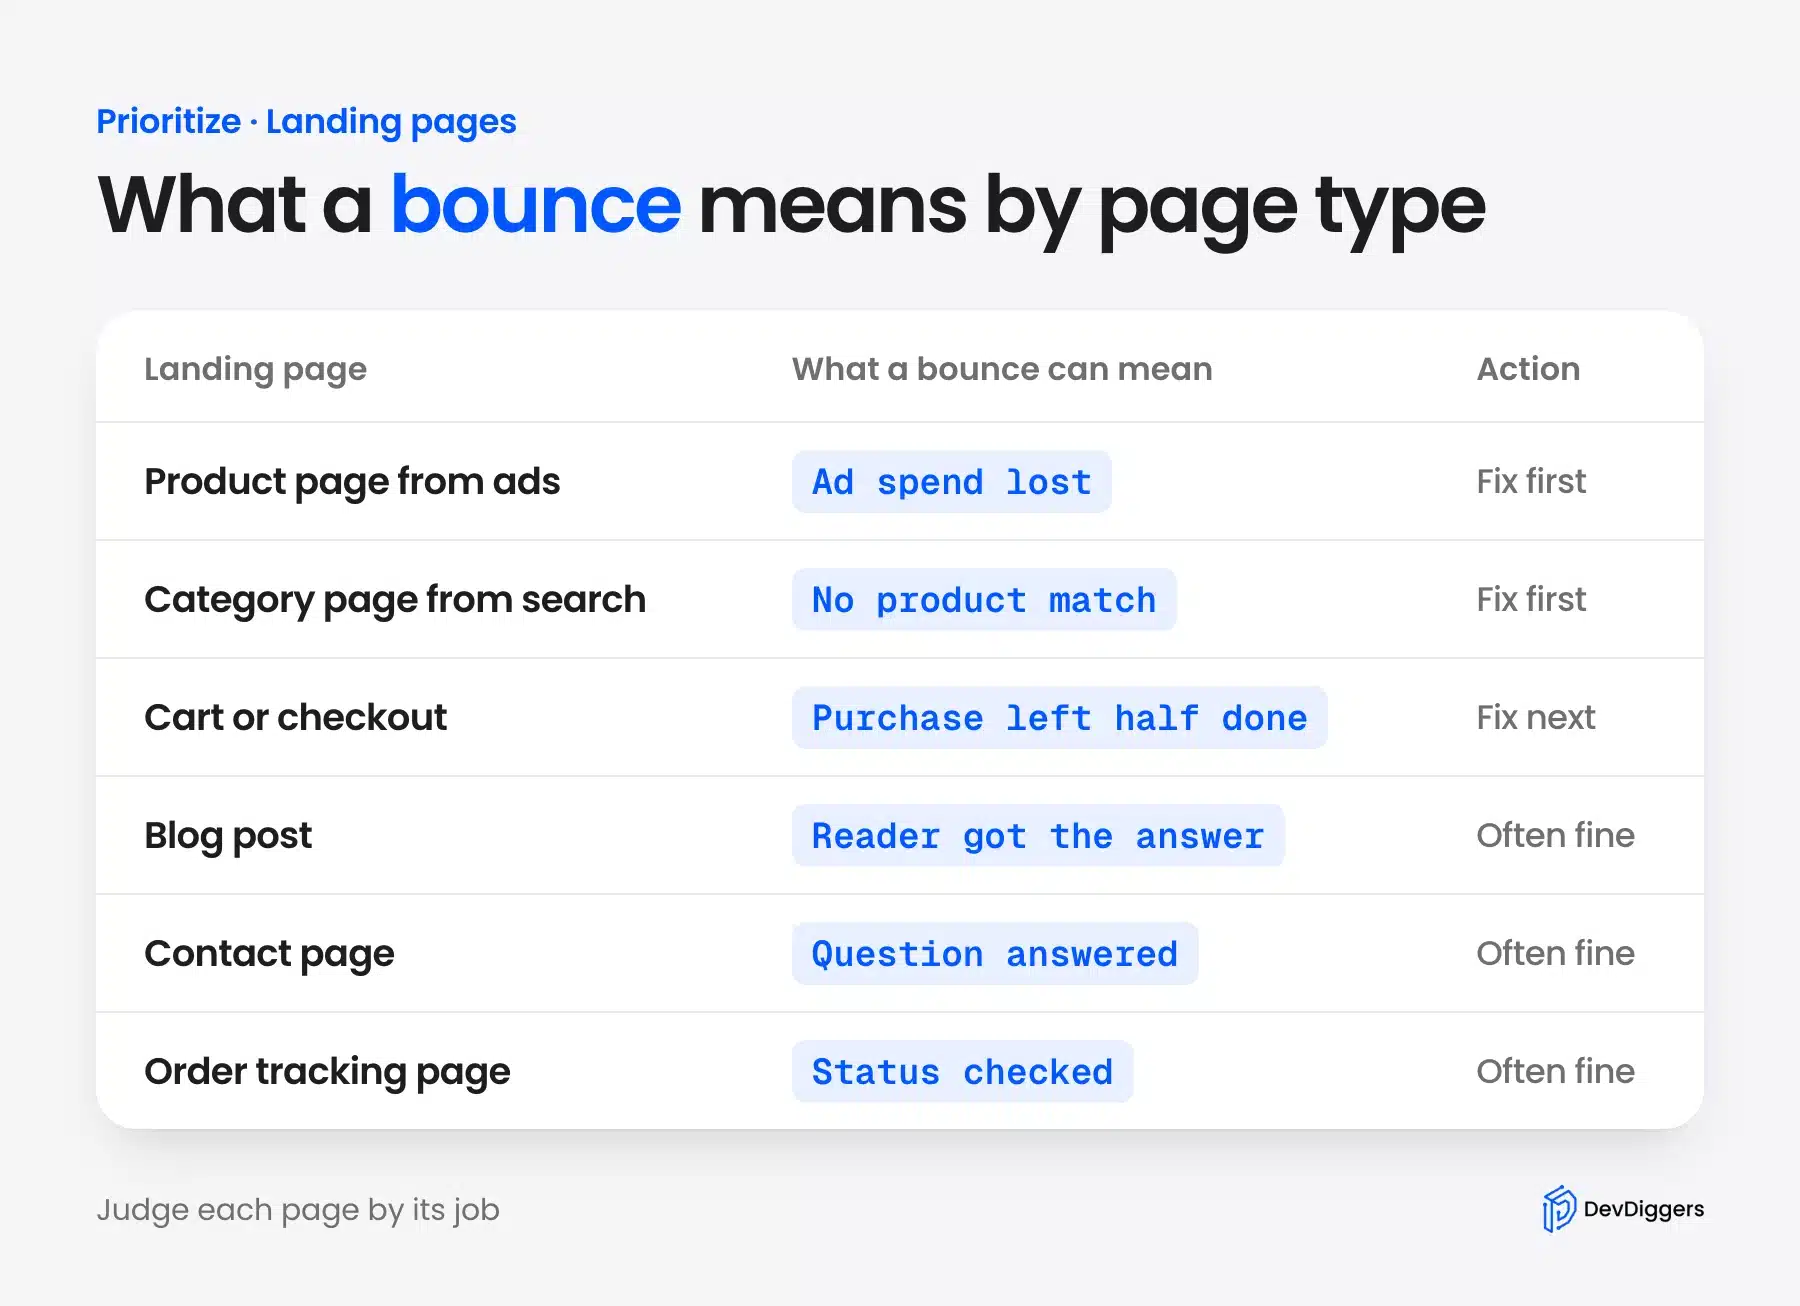
Two cautions apply to this list. A contact page or an order tracking page often answers the question in one visit. A bounce there is a success.
Also split each page by device and source before you act. A page that bounces on phones only has a mobile problem. A page that bounces for one campaign only has a message problem.
Why Is My eCommerce Bounce Rate So High?
A high eCommerce bounce rate usually traces to one of six causes. The page loads slowly, does not match the ad or hides the full price. The product page may skip answers, search may be weak or the phone layout may be hard to use.
Use this list to match what you see to the fix that applies:
- Slow loading: Visitors leave before the first screen shows. Start with fix 1.
- Unclear costs: Shoppers cannot see the full price. Start with fix 2.
- Message mismatch: The ad promised something the page does not show. Start with fix 3.
- Phone friction: Buttons are small or the menu is awkward. Start with fix 4.
- Open questions: The product page skips size, delivery or returns. Start with fix 6.
- Hard navigation: Shoppers cannot find the product. Start with fix 7.
Segment first and guess second. A page that bounces on phones only points to fixes 1 and 4. A page that bounces for one campaign only points to fix 3.
How to Reduce Bounce Rate in eCommerce: 8 Fixes
Here is how to reduce bounce rate in eCommerce in eight fixes ordered by priority. Speed, price, ad match, phone layout and guest checkout come first because Google and Baymard give numbers for them. Our two plugins follow, and offers come last.
Each fix below names a setting or number you can check yourself.
1. Speed Up the Landing Page
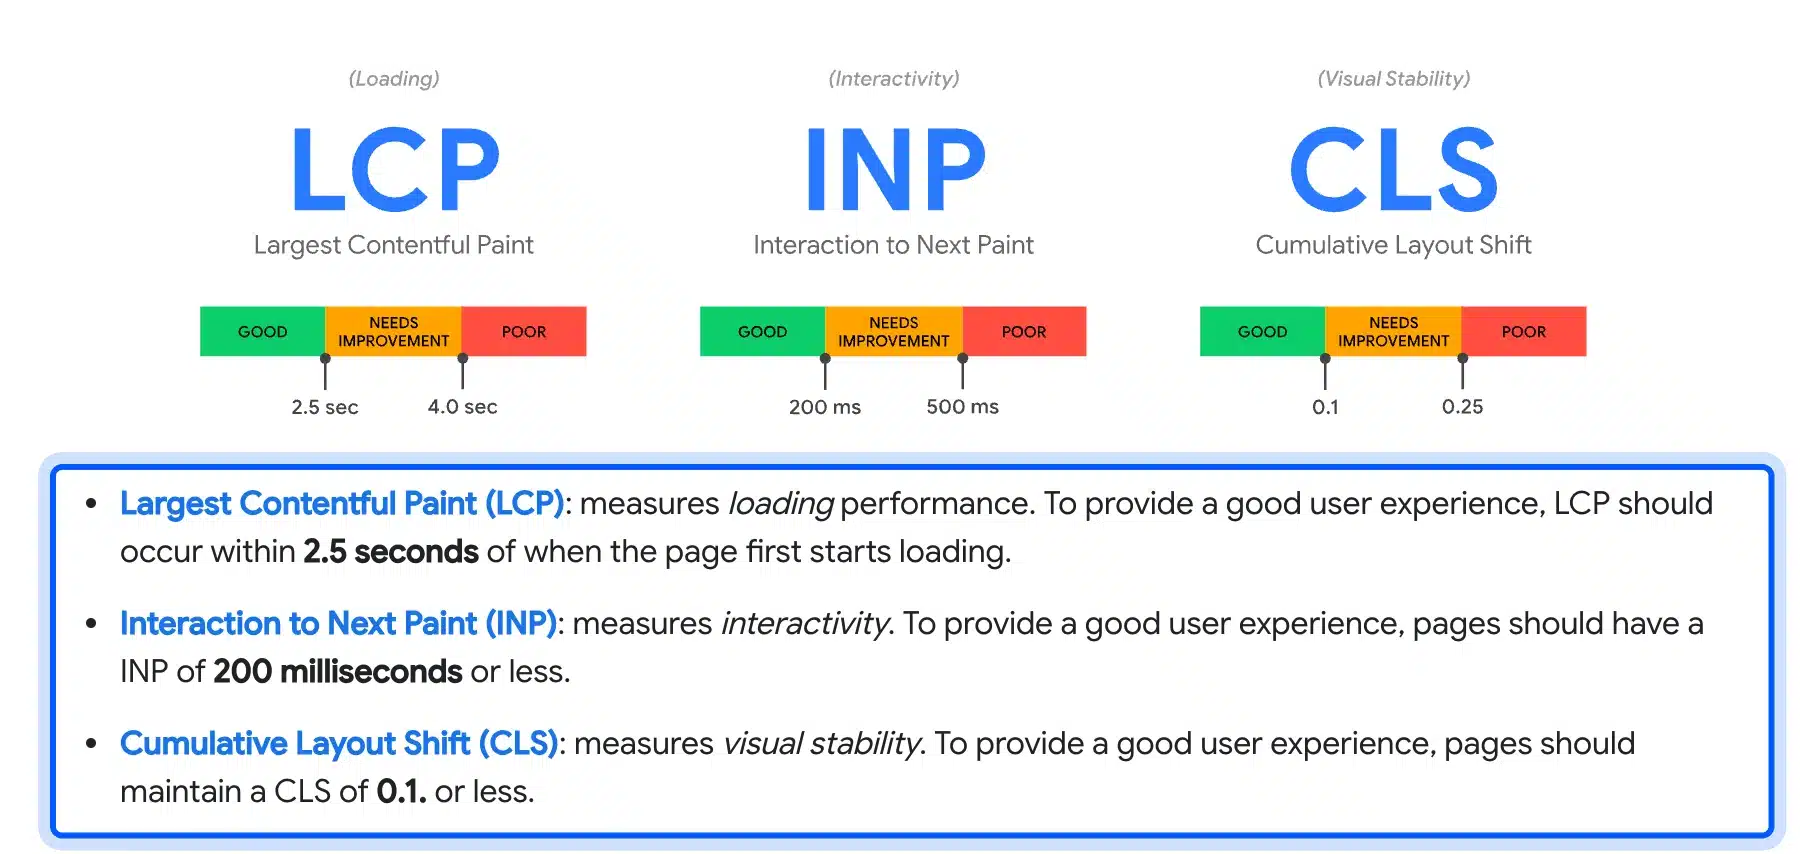
A slow page loses visitors before they see a product. Google calls a Largest Contentful Paint of 2.5 seconds or less good. It sets 200 milliseconds for Interaction to Next Paint and 0.1 for Cumulative Layout Shift.
web.dev says to measure at the 75th percentile of page loads. Its page was last updated in October 2024. Test your real product pages with PageSpeed Insights and not only the home page.
Web.dev’s LCP guide splits the time into four parts. Server response should take about 40 percent and resource load about 40 percent. The two delays should each stay under 10 percent.
Our guide to speeding up a WooCommerce website shows how to find which part is slow. A slow server or heavy theme needs hands-on work. Our WordPress speed optimization services cover that when you would rather not touch the stack yourself.
2. Show the Price and Shipping Cost Early
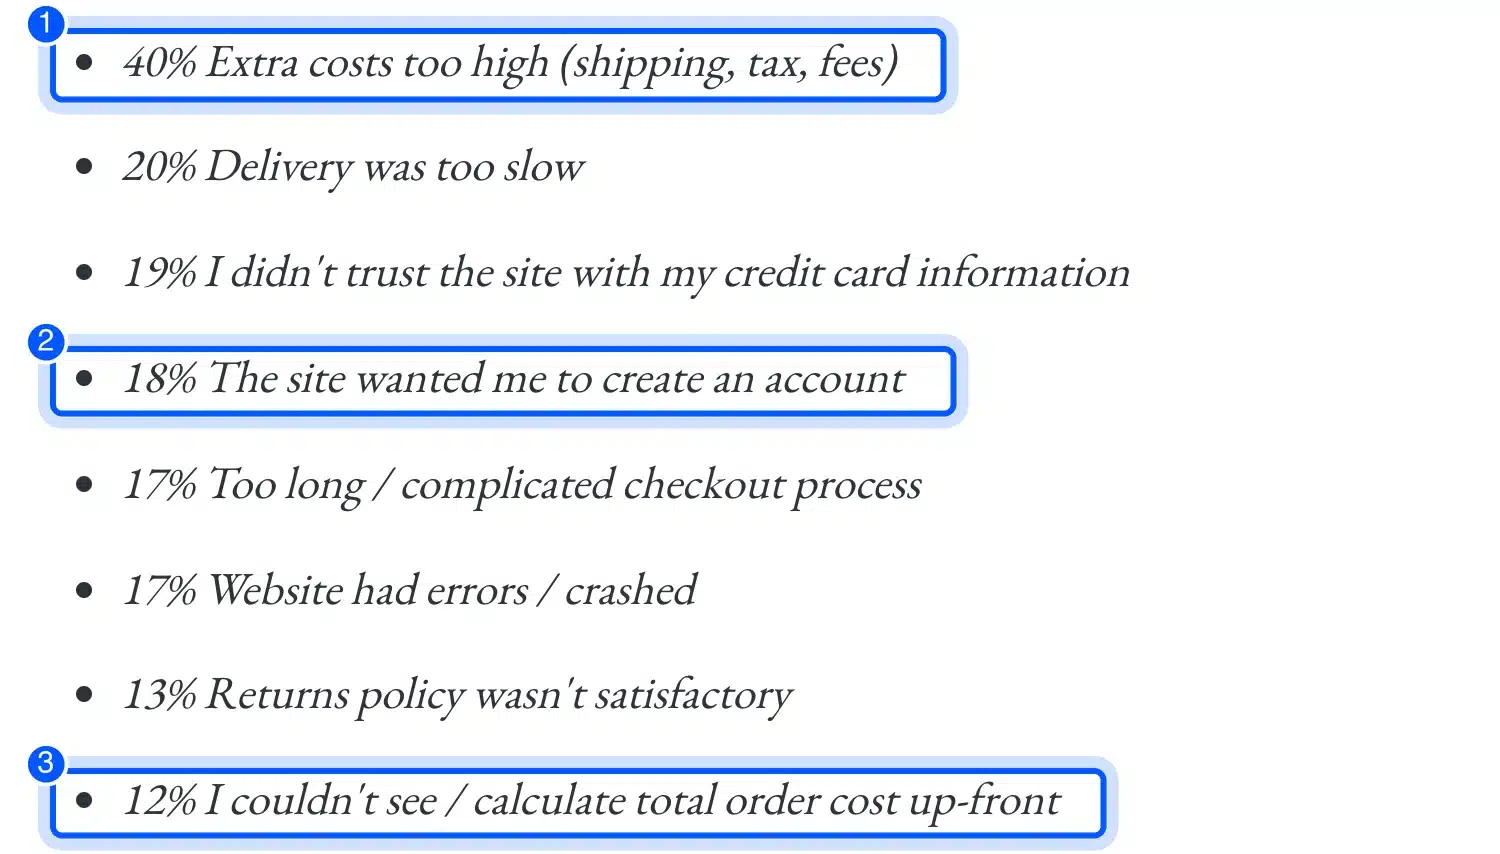
Hidden costs push shoppers away. Baymard’s research summary lists “Extra costs too high (shipping, tax, fees)” as a cause for 40 percent of cart abandonment. It also lists “I couldn’t see / calculate total order cost up-front” at 12 percent.
Baymard Institute reports an average documented cart abandonment rate of 70.22 percent across 50 studies as of September 2025. These numbers describe abandoned carts and not bounces, but the same surprise drives both.
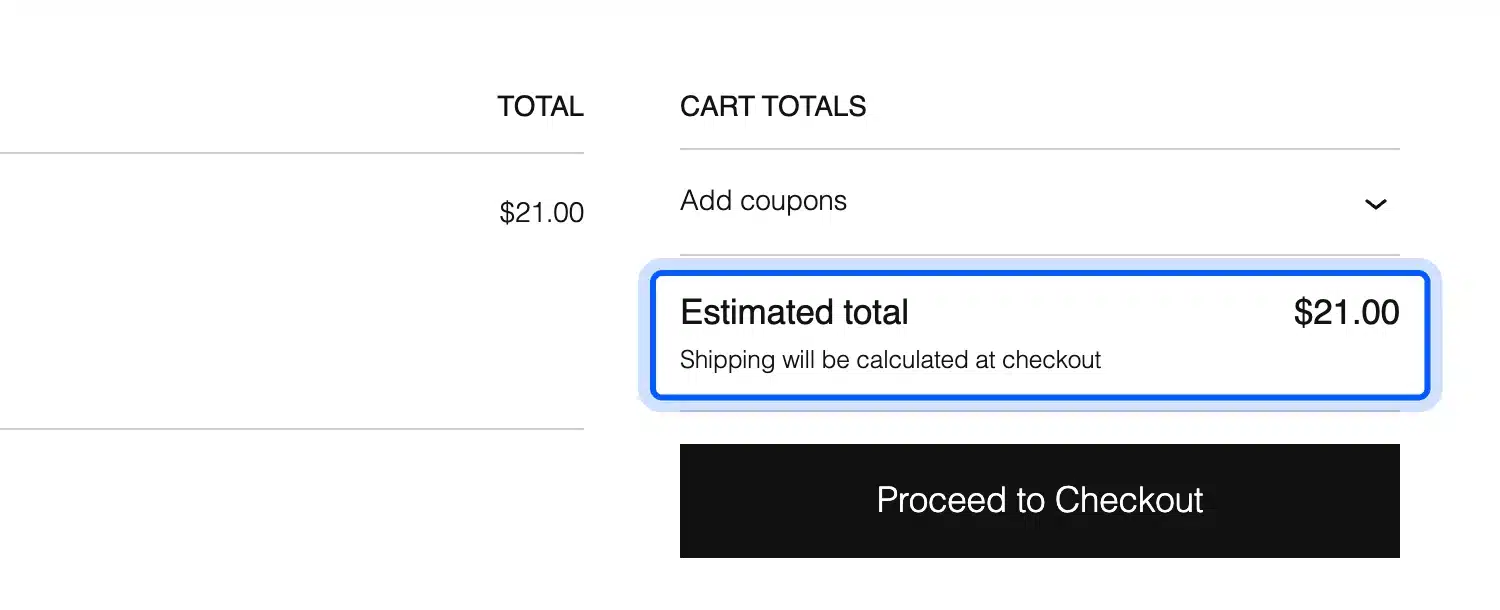
WooCommerce lets you choose when shipping shows. The setting sits under WooCommerce > Settings > Shipping > Shipping settings and is called “Hide shipping costs until an address is entered.”
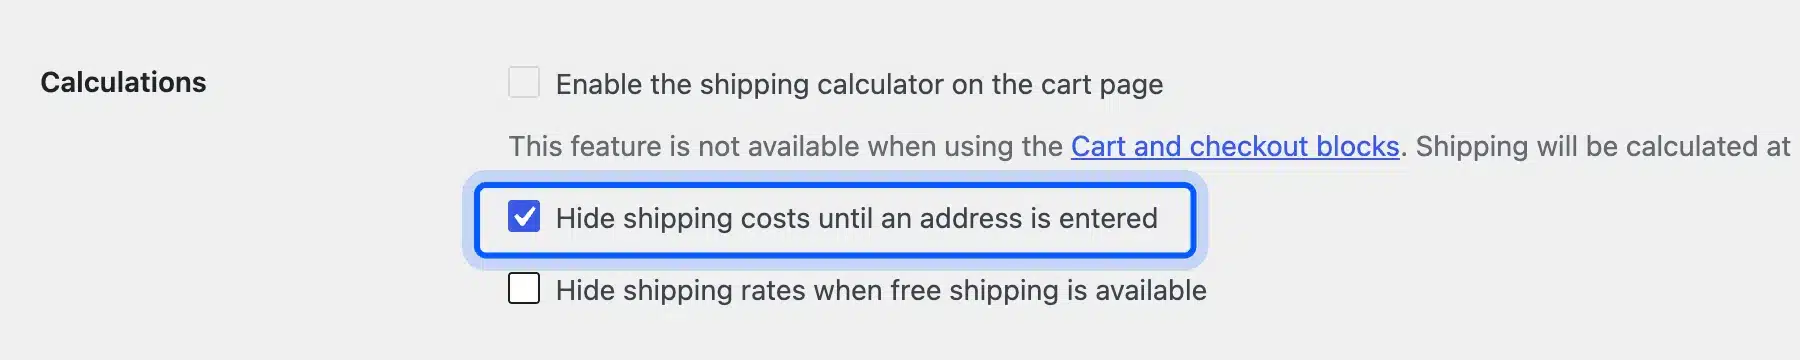
We tested it on our test store. With it on, the cart said “Shipping will be calculated at checkout” and showed a total with no shipping.
With the option off, the same cart showed a $6.00 flat rate at once. Showing the cost early is the safer default for a store that ships to one region.
3. Match the Landing Page to the Ad or Search Result
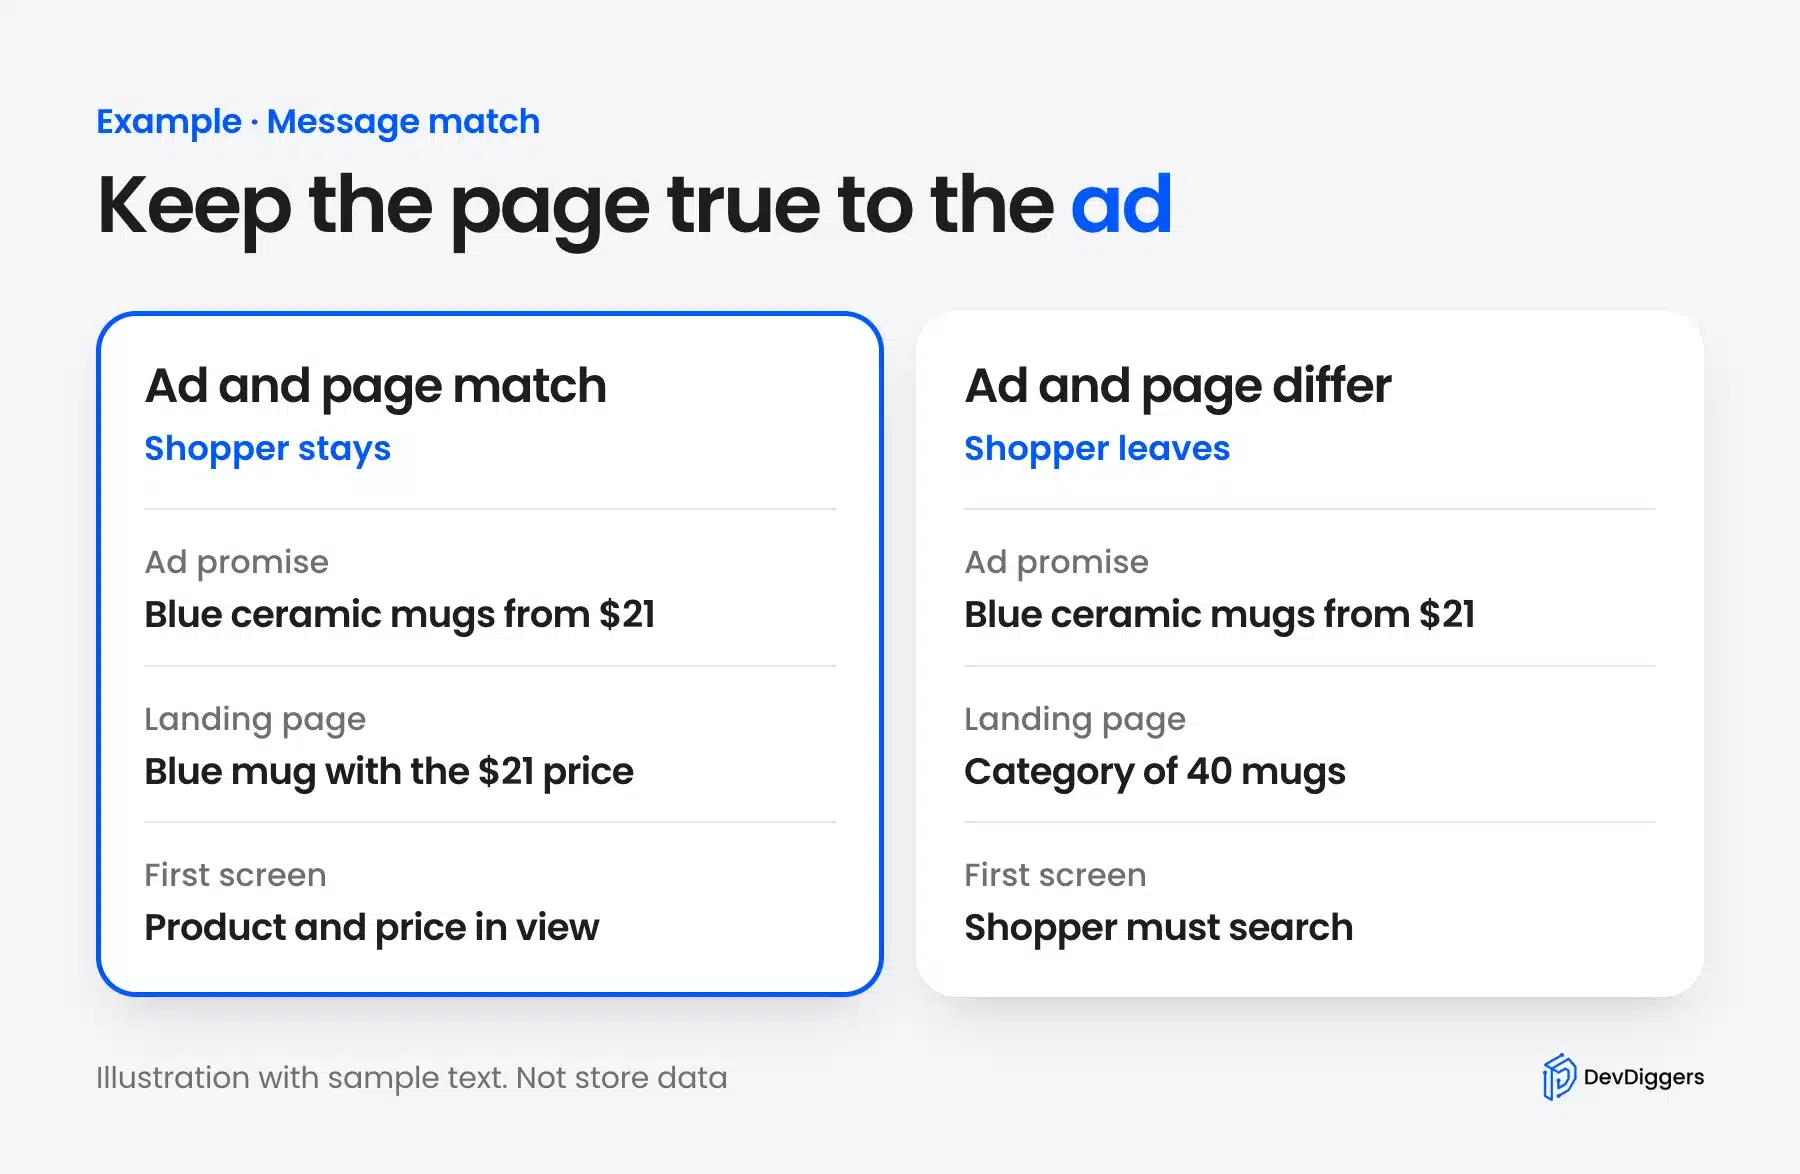
A shopper who clicks an ad for a blue mug and lands on a category of 40 mugs may leave. The page should show what the ad promised on the first screen. Send each campaign to its own product page or filtered category.
Say an ad offers “Blue ceramic mugs from $21”. The landing page should show a blue mug and the $21 price without scrolling. A different price or a missing product breaks the promise.
Check this in GA4 by adding source and medium as a second dimension on the Landing page report. One campaign far above the rest points to a message mismatch.
4. Fix the Mobile Layout
Check your layout on a small screen first. Buttons and links need room for a thumb. WCAG 2.2 sets a target size of at least 24 by 24 CSS pixels at Level AA.
We measured our test store at 390 pixels wide. The Add to cart button was 152 by 55 pixels and the quantity box 65 by 55. The menu button measured 24 by 24 pixels and only just meets the minimum.
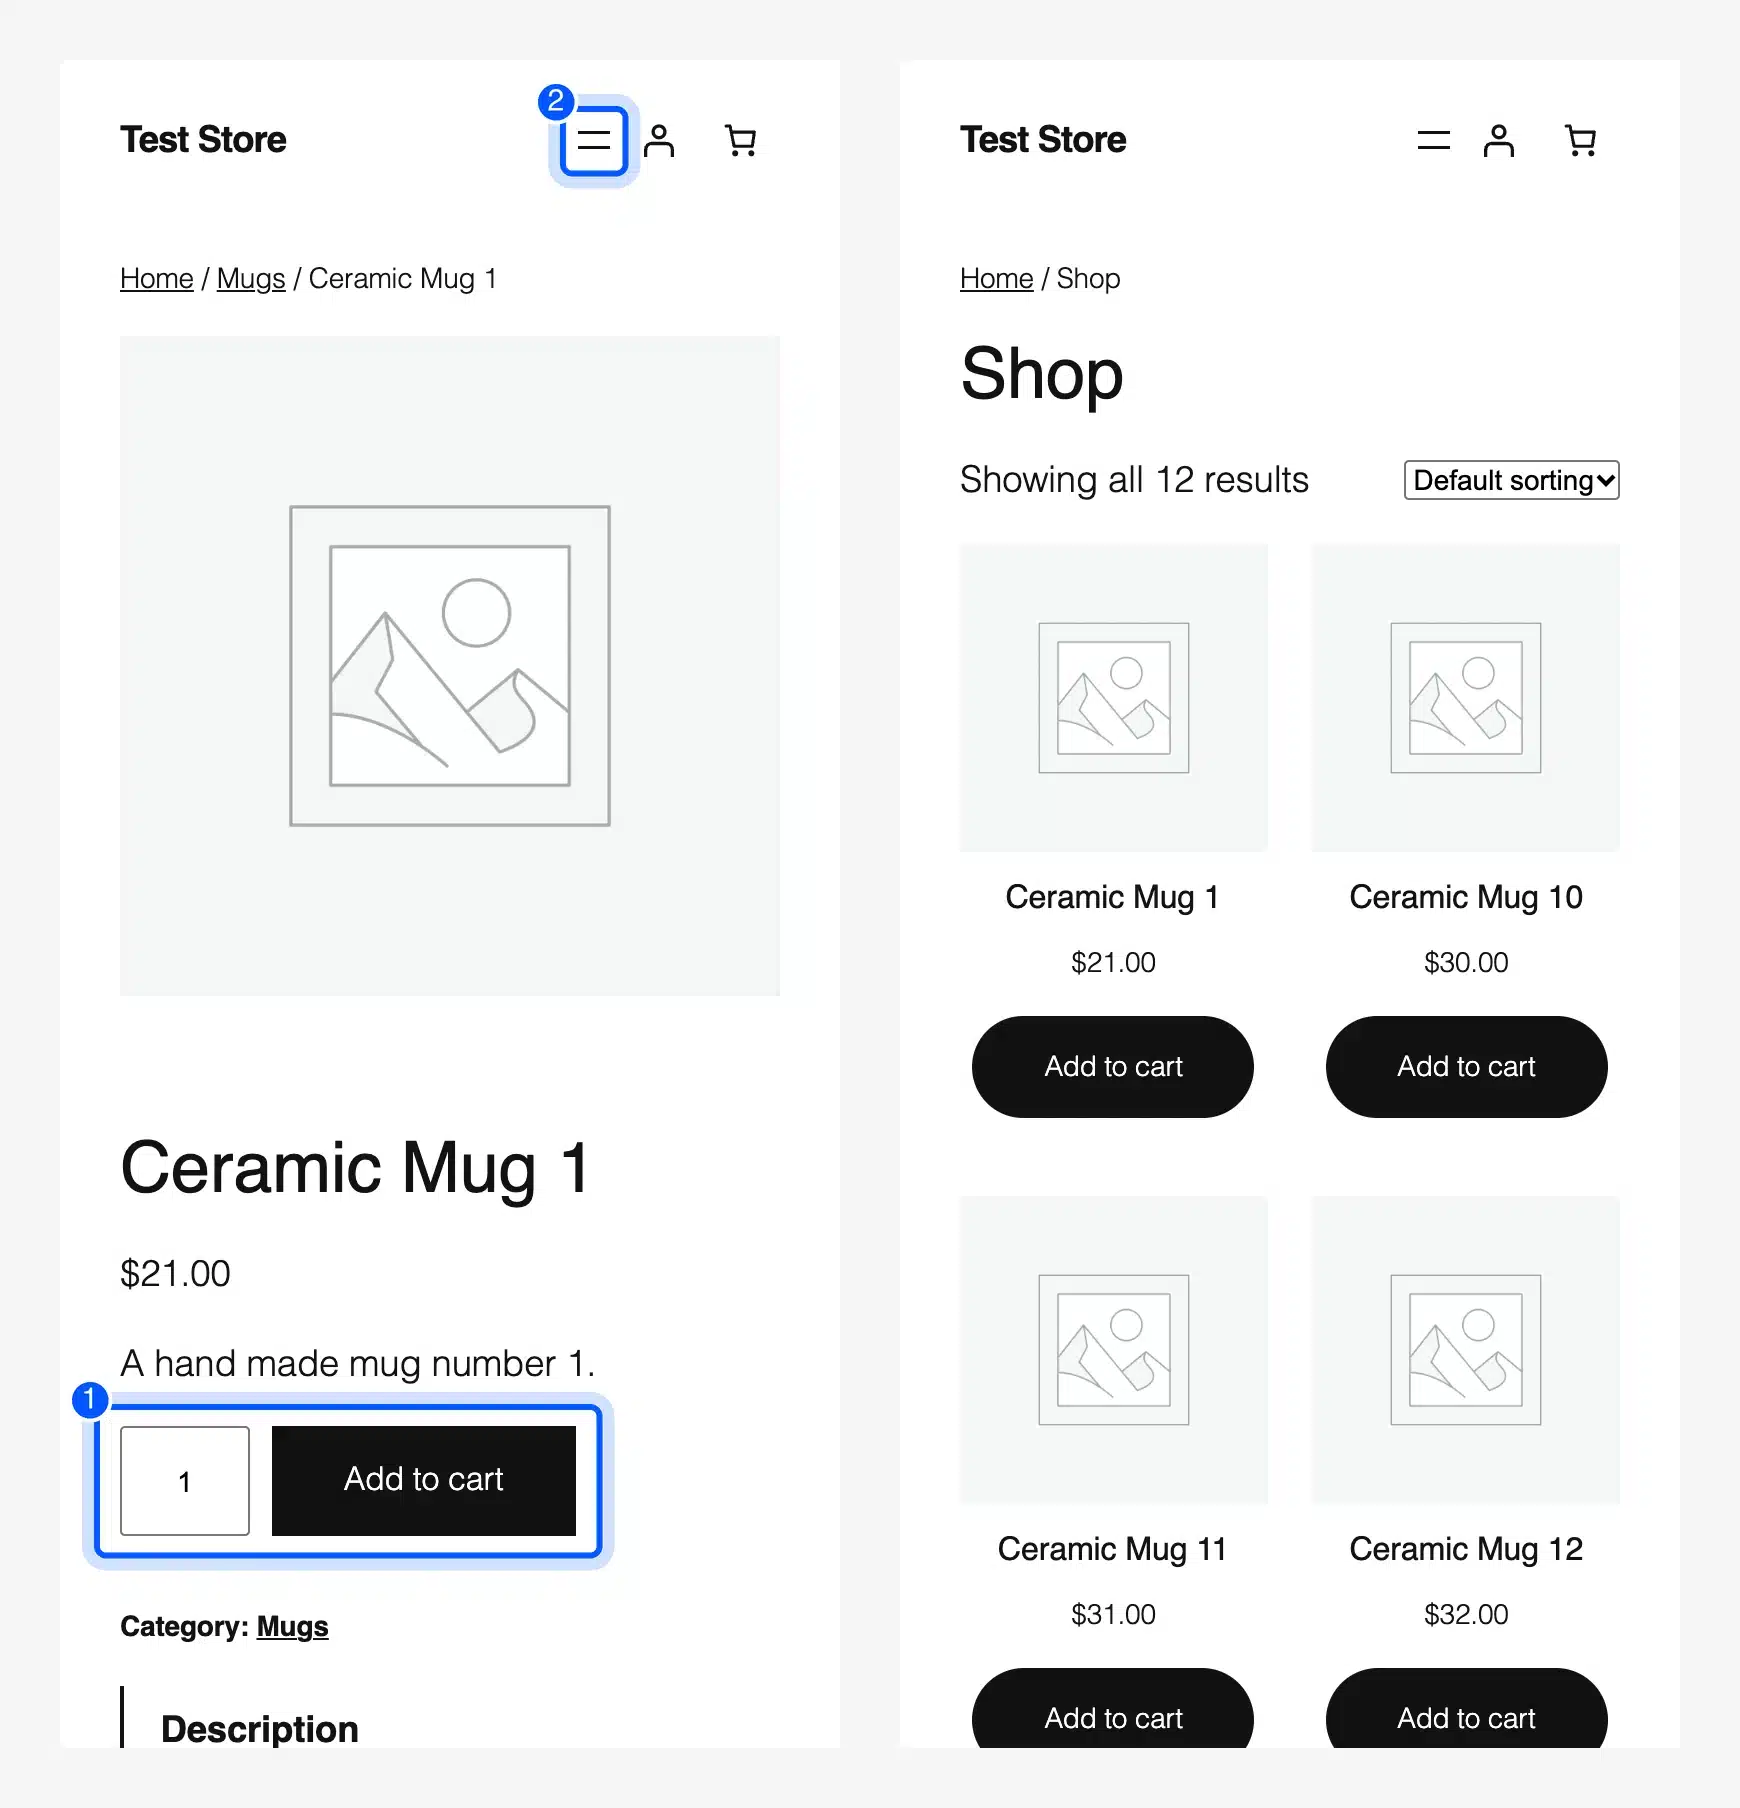
The page did not scroll sideways at 390 pixels. Test your own store the same way with your browser’s device mode. Try the menu, the filters and the checkout with one thumb.
5. Let Guests Check Out
Forced accounts make shoppers stop. Baymard lists “The site wanted me to create an account” as a cause for 18 percent of abandoned carts. WooCommerce has a setting for this under WooCommerce > Settings > Accounts & Privacy.
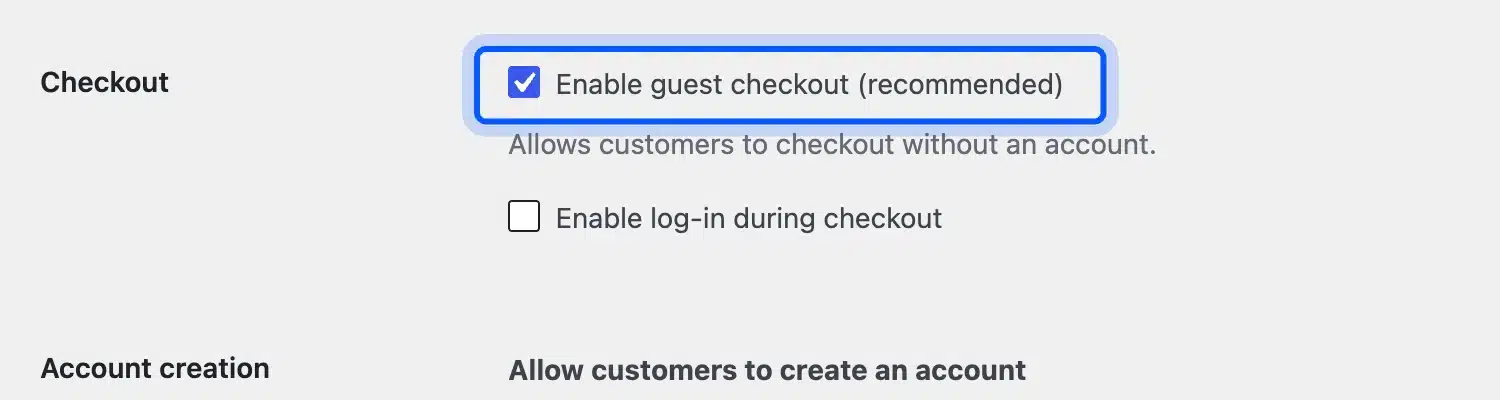
We turned off “Enable guest checkout (recommended)” on our test store. The block checkout then showed only “You must be logged in to checkout.” No form appeared.

A new visitor would have to stop and register. Keep guest checkout on unless you have a strong reason. The Account creation option “After checkout (recommended)” offers an account once the order is placed.
Our guide to one-click checkout in WooCommerce removes more steps.
6. Answer Buyer Questions with 3D and AR on the Product Page
A product page must answer four questions fast: what it is, what it costs, when it arrives and whether the store can be trusted. Put the price and the Add to cart button where the shopper lands.
We measured this on our test store at a 390 by 844 pixel phone screen. The price sat 594 pixels from the top and the Add to cart button 683 pixels. Both showed without scrolling.
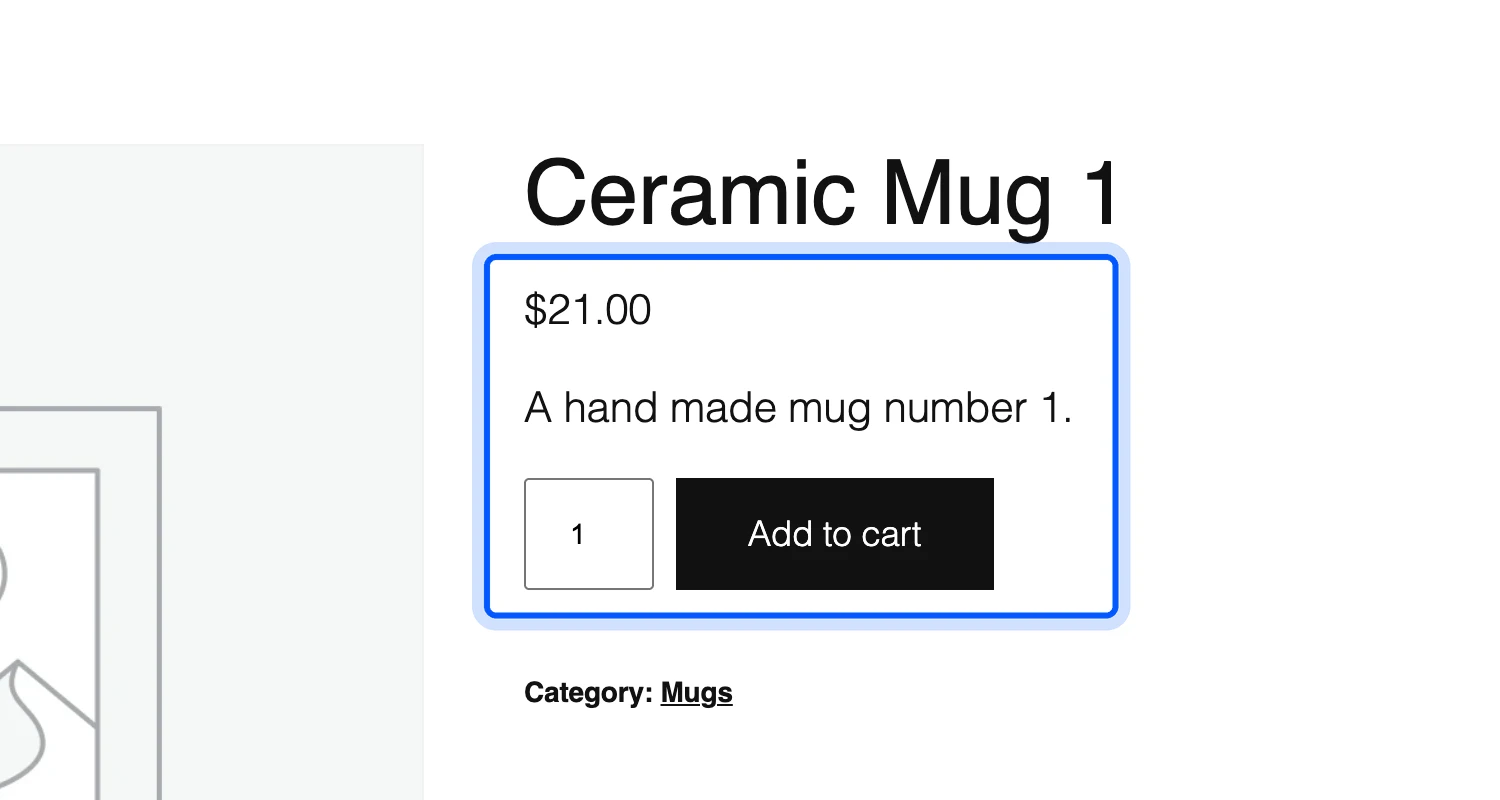
Size is the question a photo cannot answer. Our WooCommerce AR plugin shows the product in 3D on the page and in the shopper’s room on a phone. We found no study that says AR lowers bounce rate.
It answers the size doubt behind the open questions cause. We ran the Pro build, version 2.0.0, on our test store.
- Install the plugin. Go to Plugins > Add Plugin > Upload Plugin, choose the zip file and click Activate. Add your license key under Product View in AR > Configuration > License.
- Open Product View in AR > Configuration > General. Tick Enable WooCommerce Product View in AR. Then tick 3D View, Preload, Auto Rotation and Dimensions. Click Save Changes.
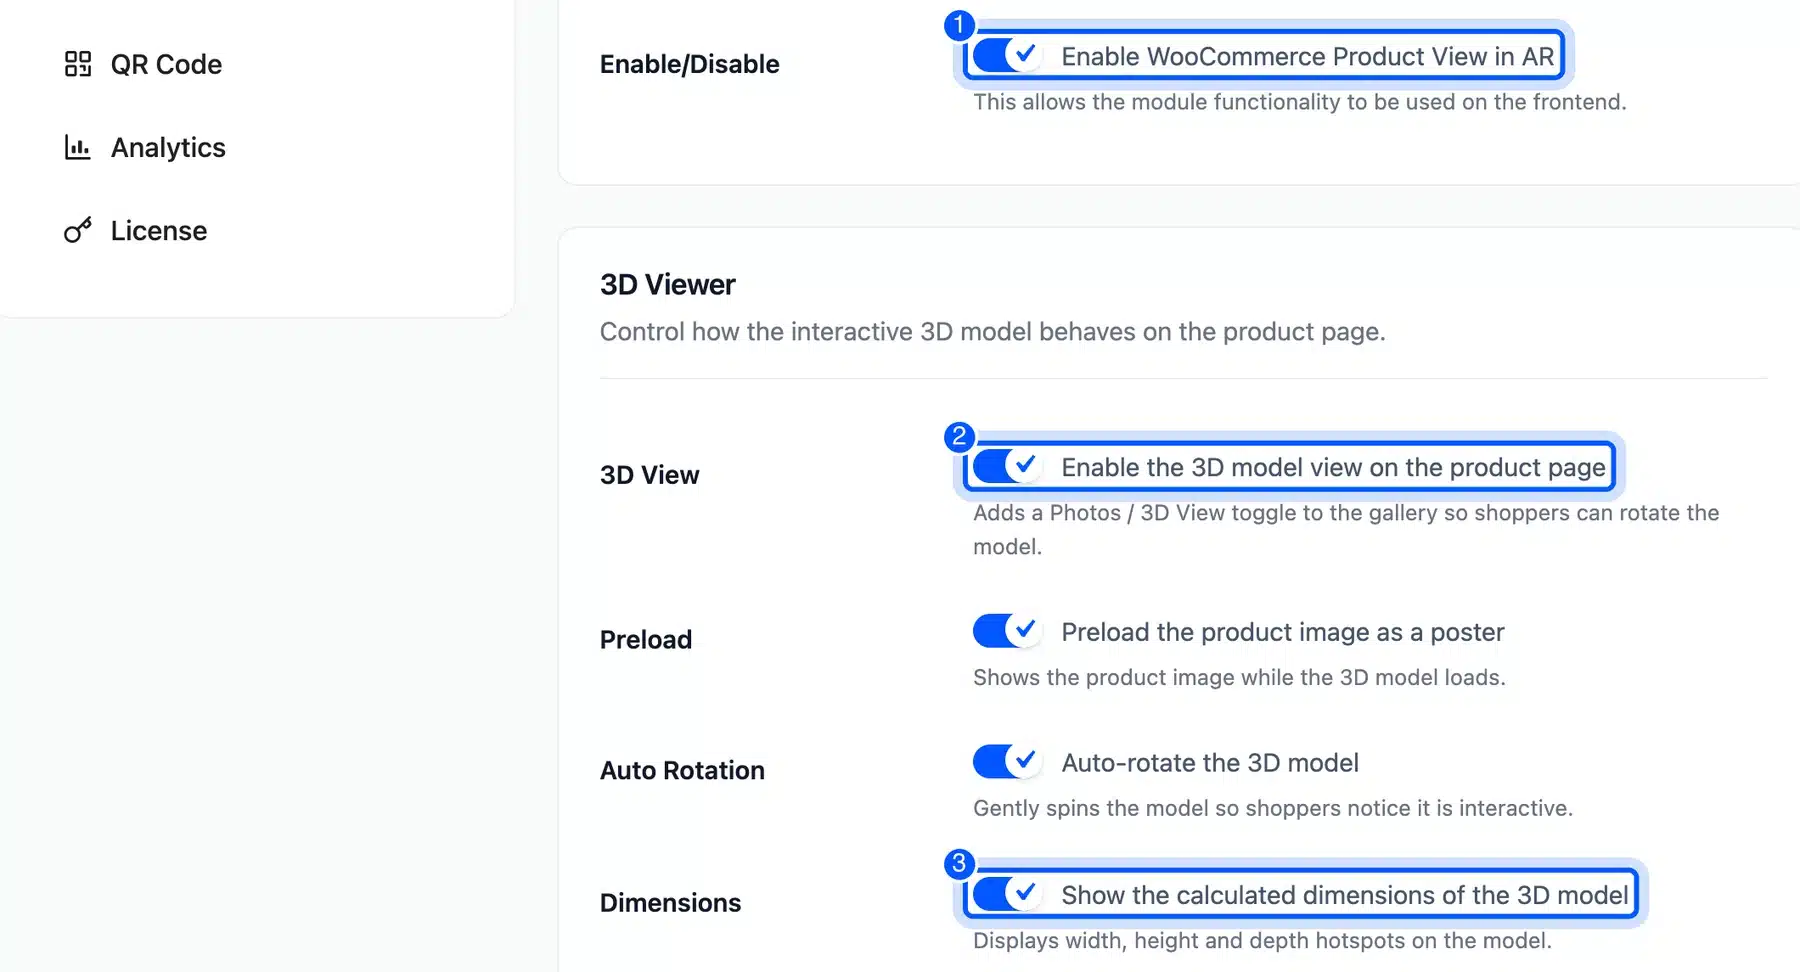
- Open the QR Code tab and tick Enable QR Code. Desktop shoppers can then open AR on their phone. Click Save Changes again.
- Open Product View in AR > Products. Click Upload beside Android (GLB) and iOS (USDZ) on a product. We used the two sample files that ship with the plugin, a wooden side table. The status changed from Inactive to Active.

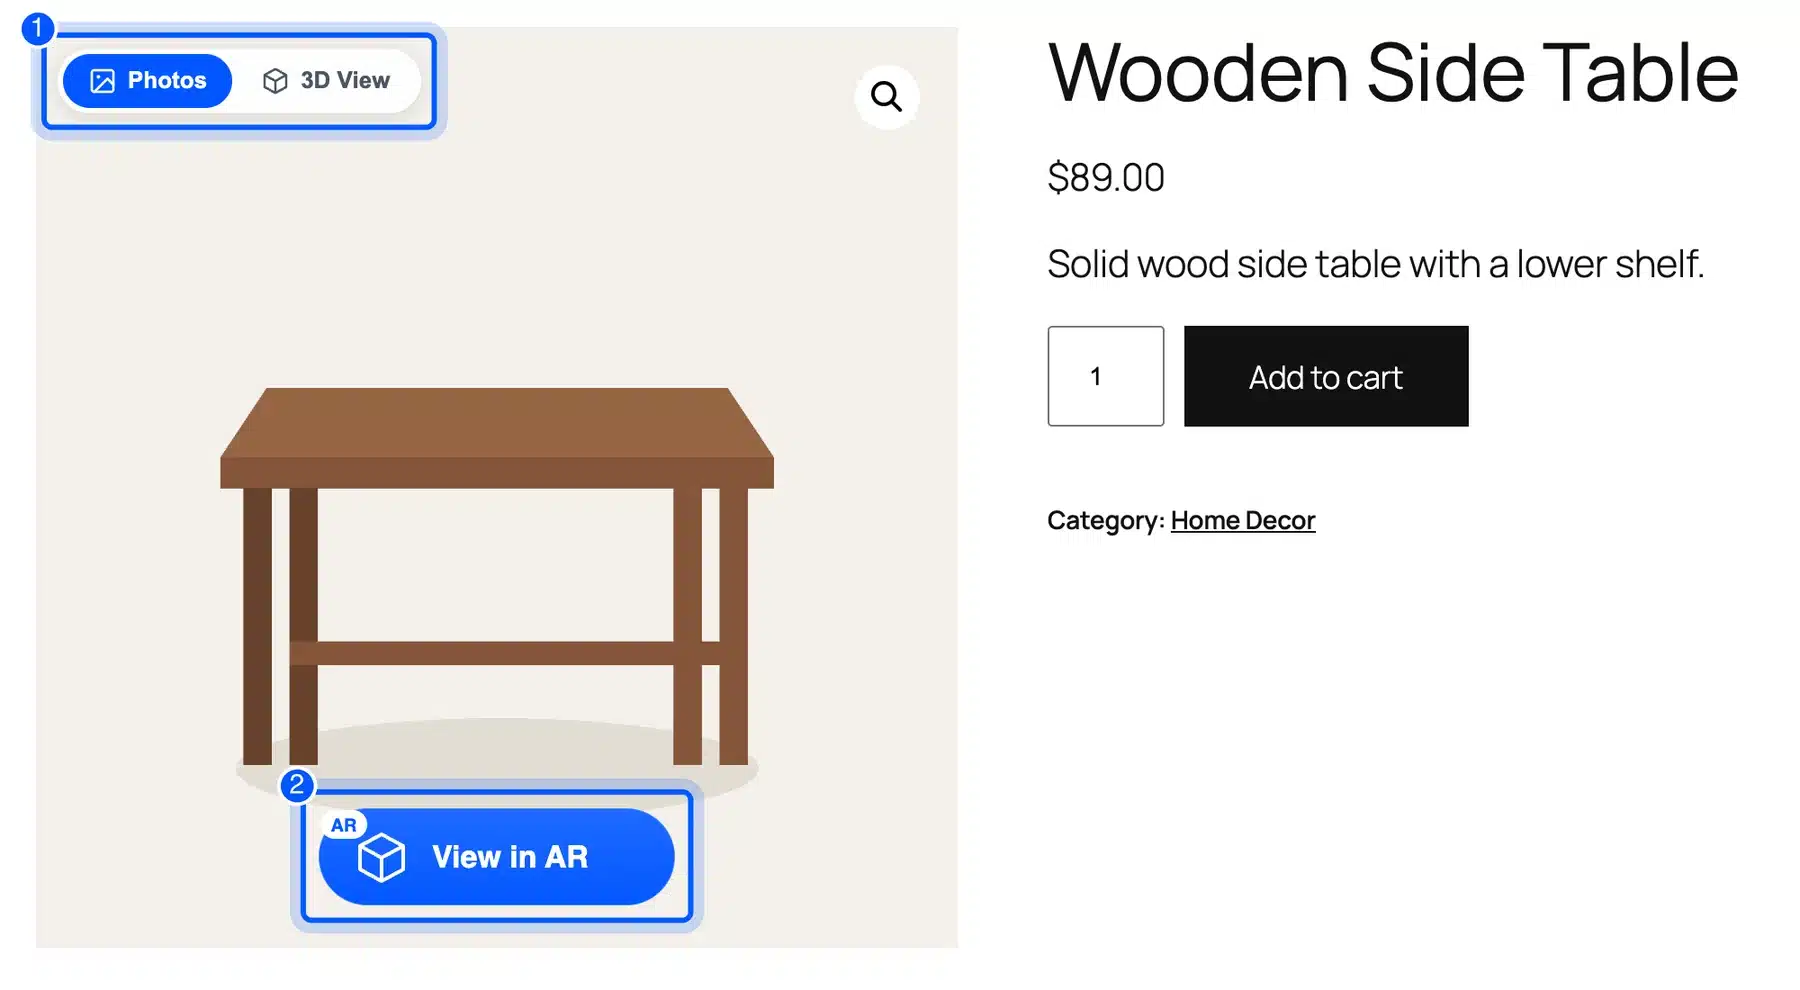
- Open the product page. The gallery now has a Photos and 3D View toggle and a View in AR button. It worked on Twenty Twenty-Five, a block theme.
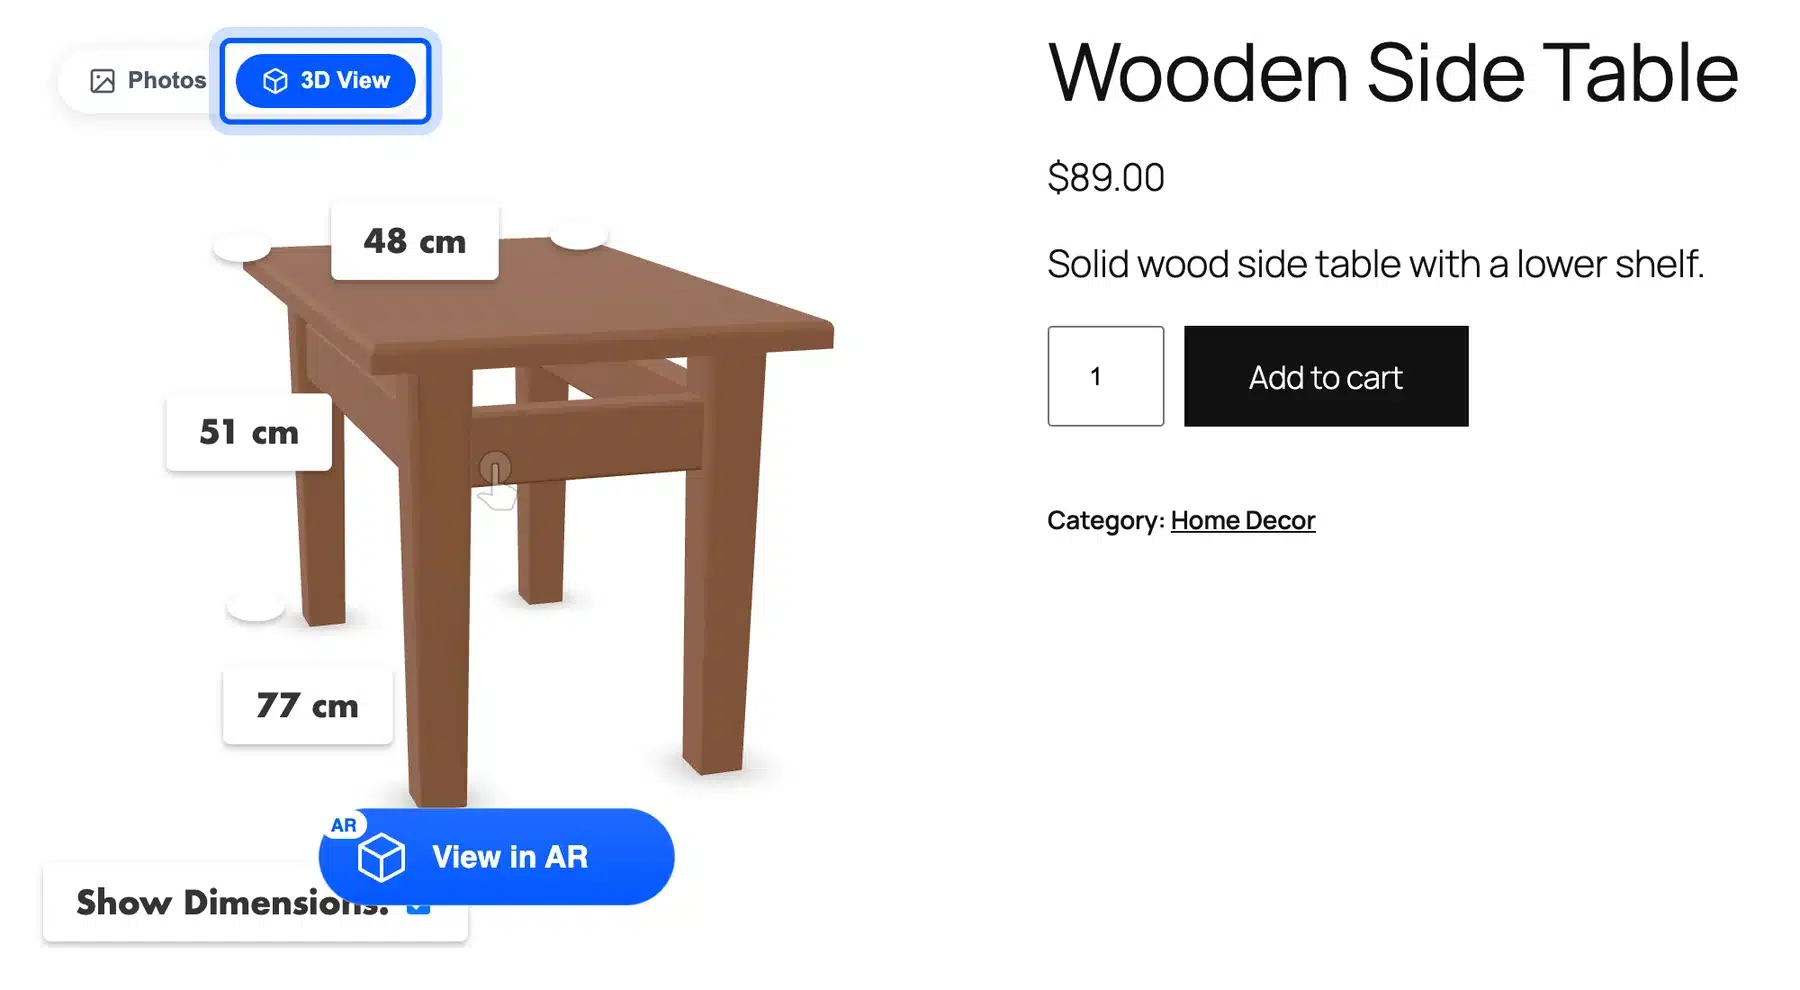
- Click 3D View. The model turned on its own and labeled its size as 48, 51 and 77 cm.
- Click View in AR on a desktop. A popup titled “View in your space” showed a QR code and the line “Scan with your phone to view this product in AR.”
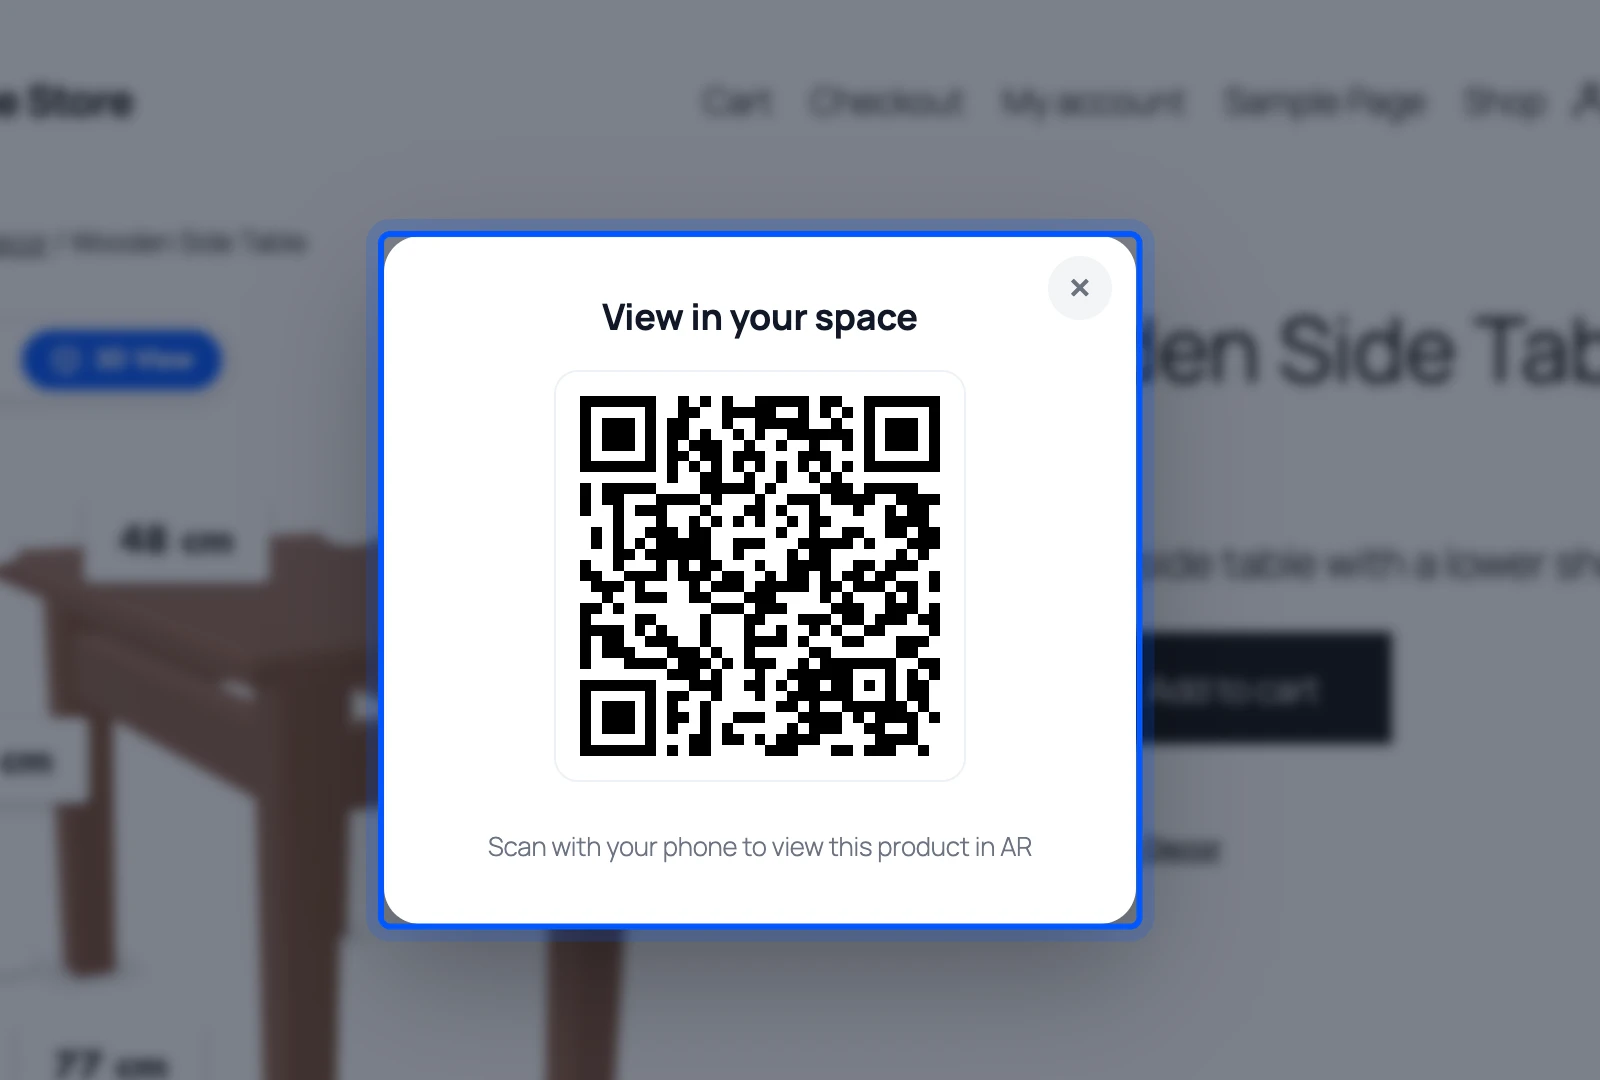
The Products list also counts AR views for each product. Ours read 5 after our test visits. The AR view itself opens on a phone, and we did not run that on a device.
Licenses start at $59 as of October 2026 on the product page. Add what a shopper cannot guess: sizes, materials, delivery time and the return window. Our guides to the PDP in eCommerce and to building buyer confidence list what to include.
7. Make Search Easy with Search by Image
A shopper who cannot find a product in a few seconds may leave. Add a visible search box and keep the menu to a few clear categories. Breadcrumbs help a visitor who lands deep in the catalog.
Our test store theme had no search box in its header by default. We added a Search block to the header template to fix that. Some shoppers have a photo and no name for the product.
Our Product Search by Image plugin adds an image icon to that search box. We ran the Pro build, version 1.3.0, on our test store.
- Install and activate the plugin as in fix 6. Add your license key under Product Search By Image AI > Configuration > License.
- Open Product Search By Image AI > Configuration > General. Tick Enable WooCommerce Product Search By Image AI. Keep AI Service Provider on TensorFlow.js (Client-side, Free). Set Search Type to Products Image Tags and click Save Changes.
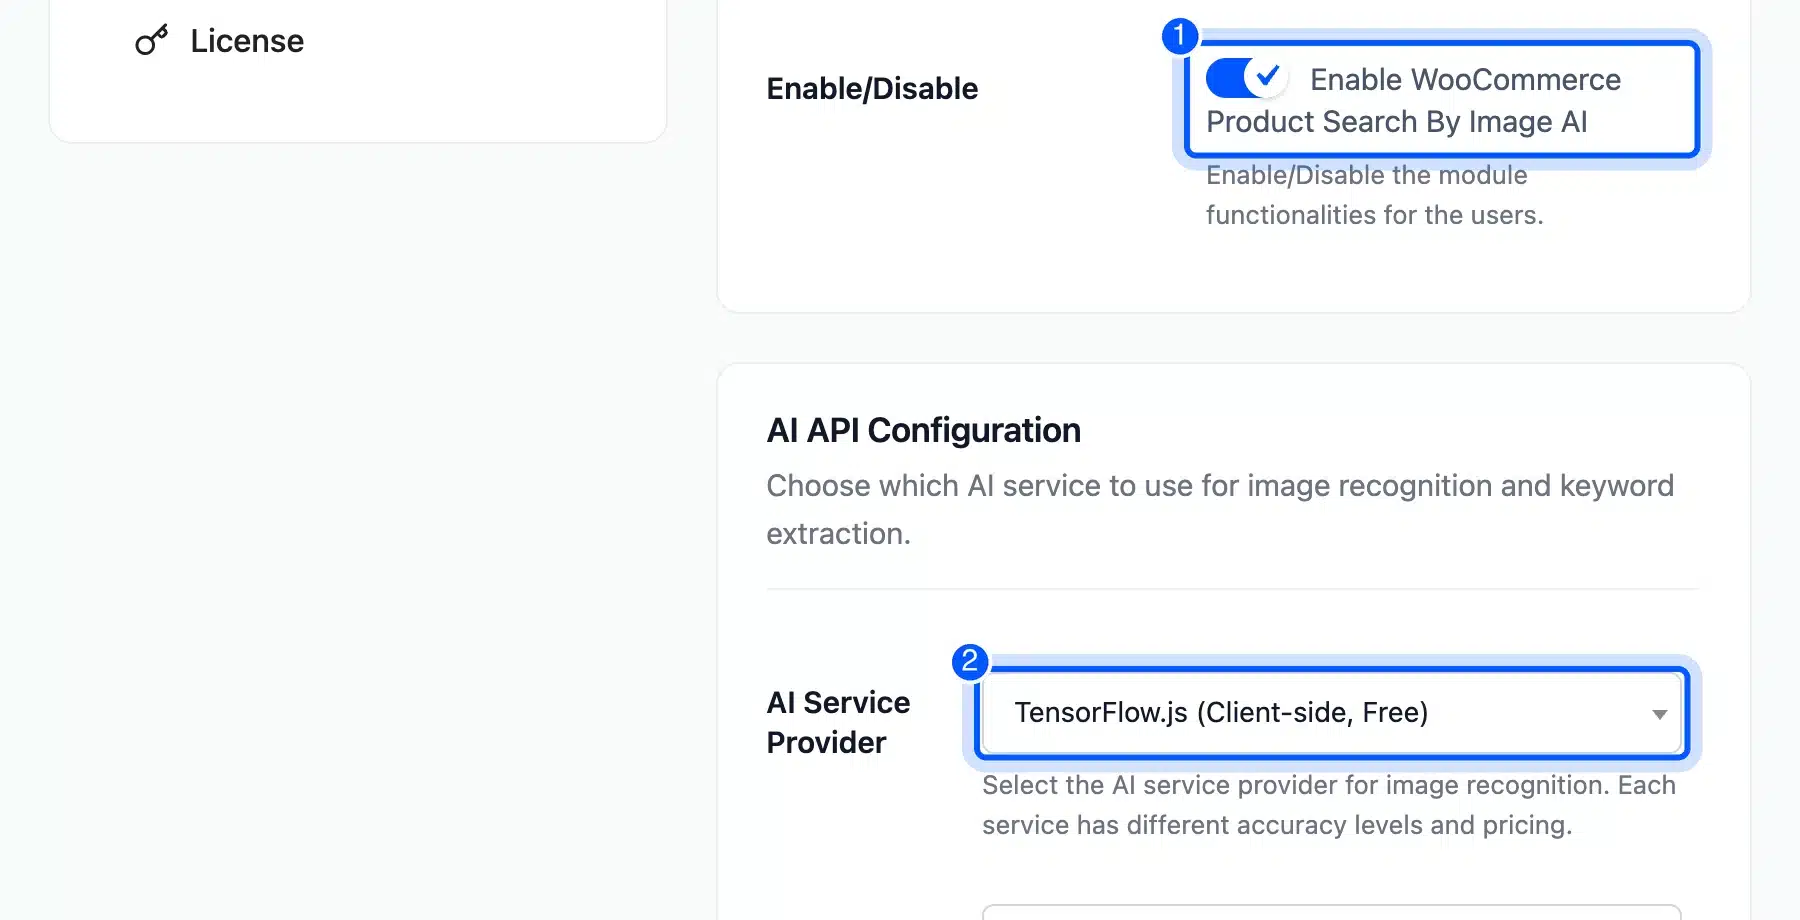
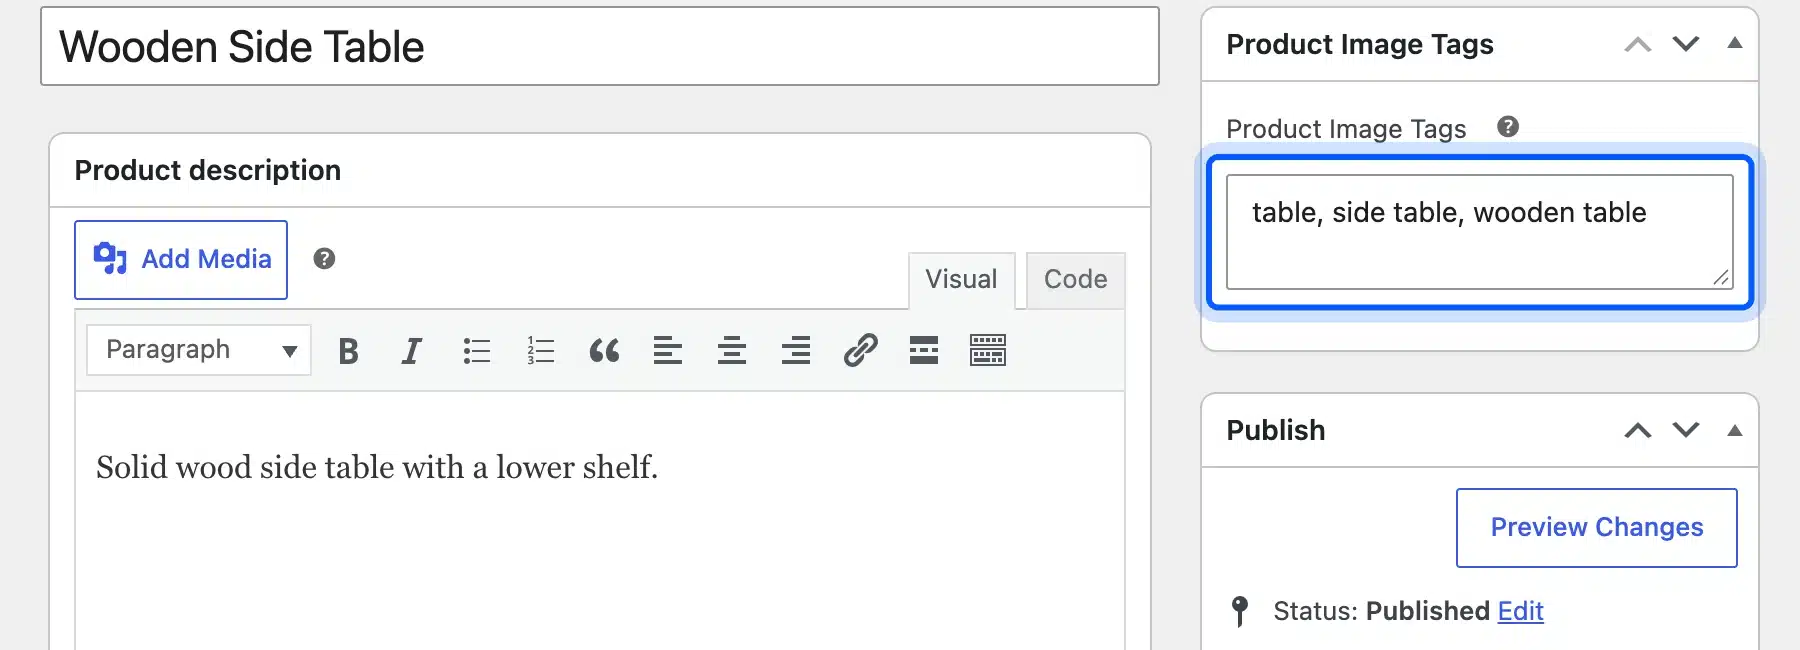
- Open a product and fill in the Product Image Tags box with words a photo might match. We typed “table, side table, wooden table” on the side table. Do the same on every product you want shoppers to find by photo.
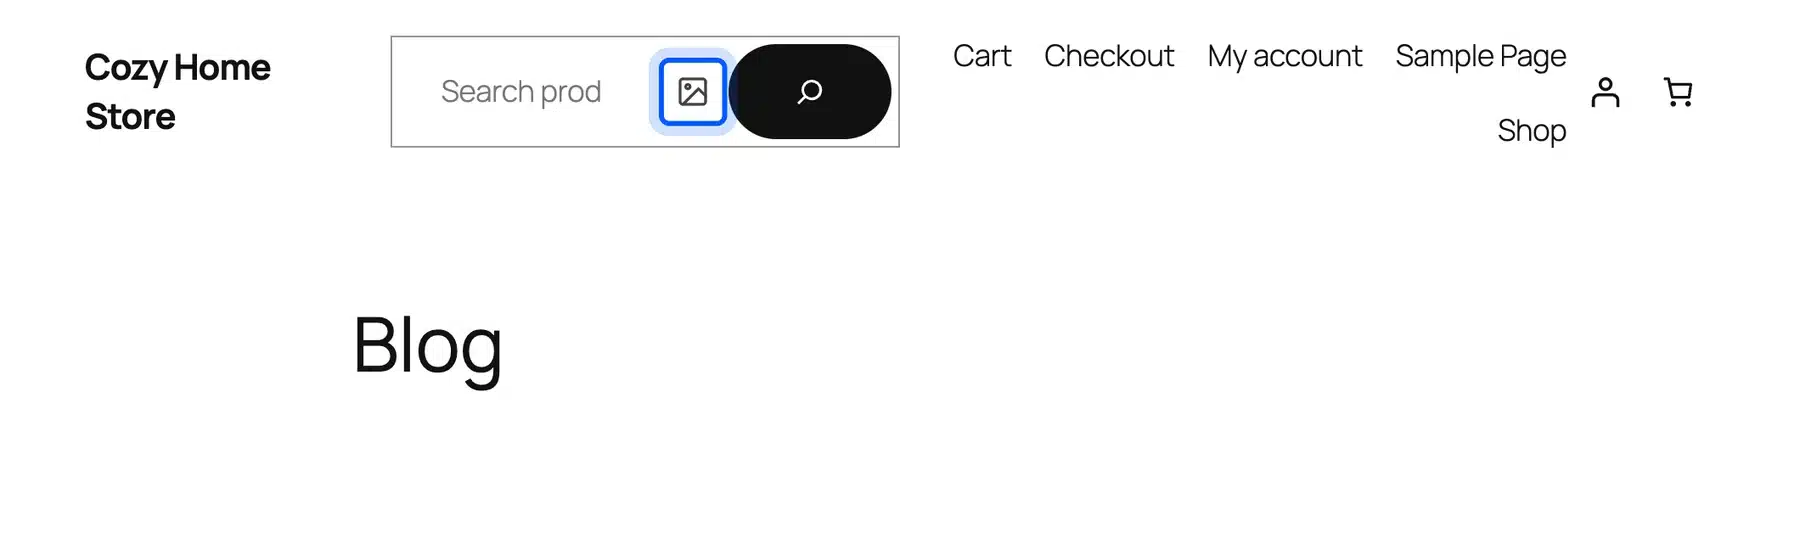
- Open the store. The search box now shows a small image icon next to the search button.
- Click the icon and pick a photo. We used a rendered picture of a side table. The plugin read it in the browser and searched for chime, bell, gong, dining table, dining, table, board and hourglass.
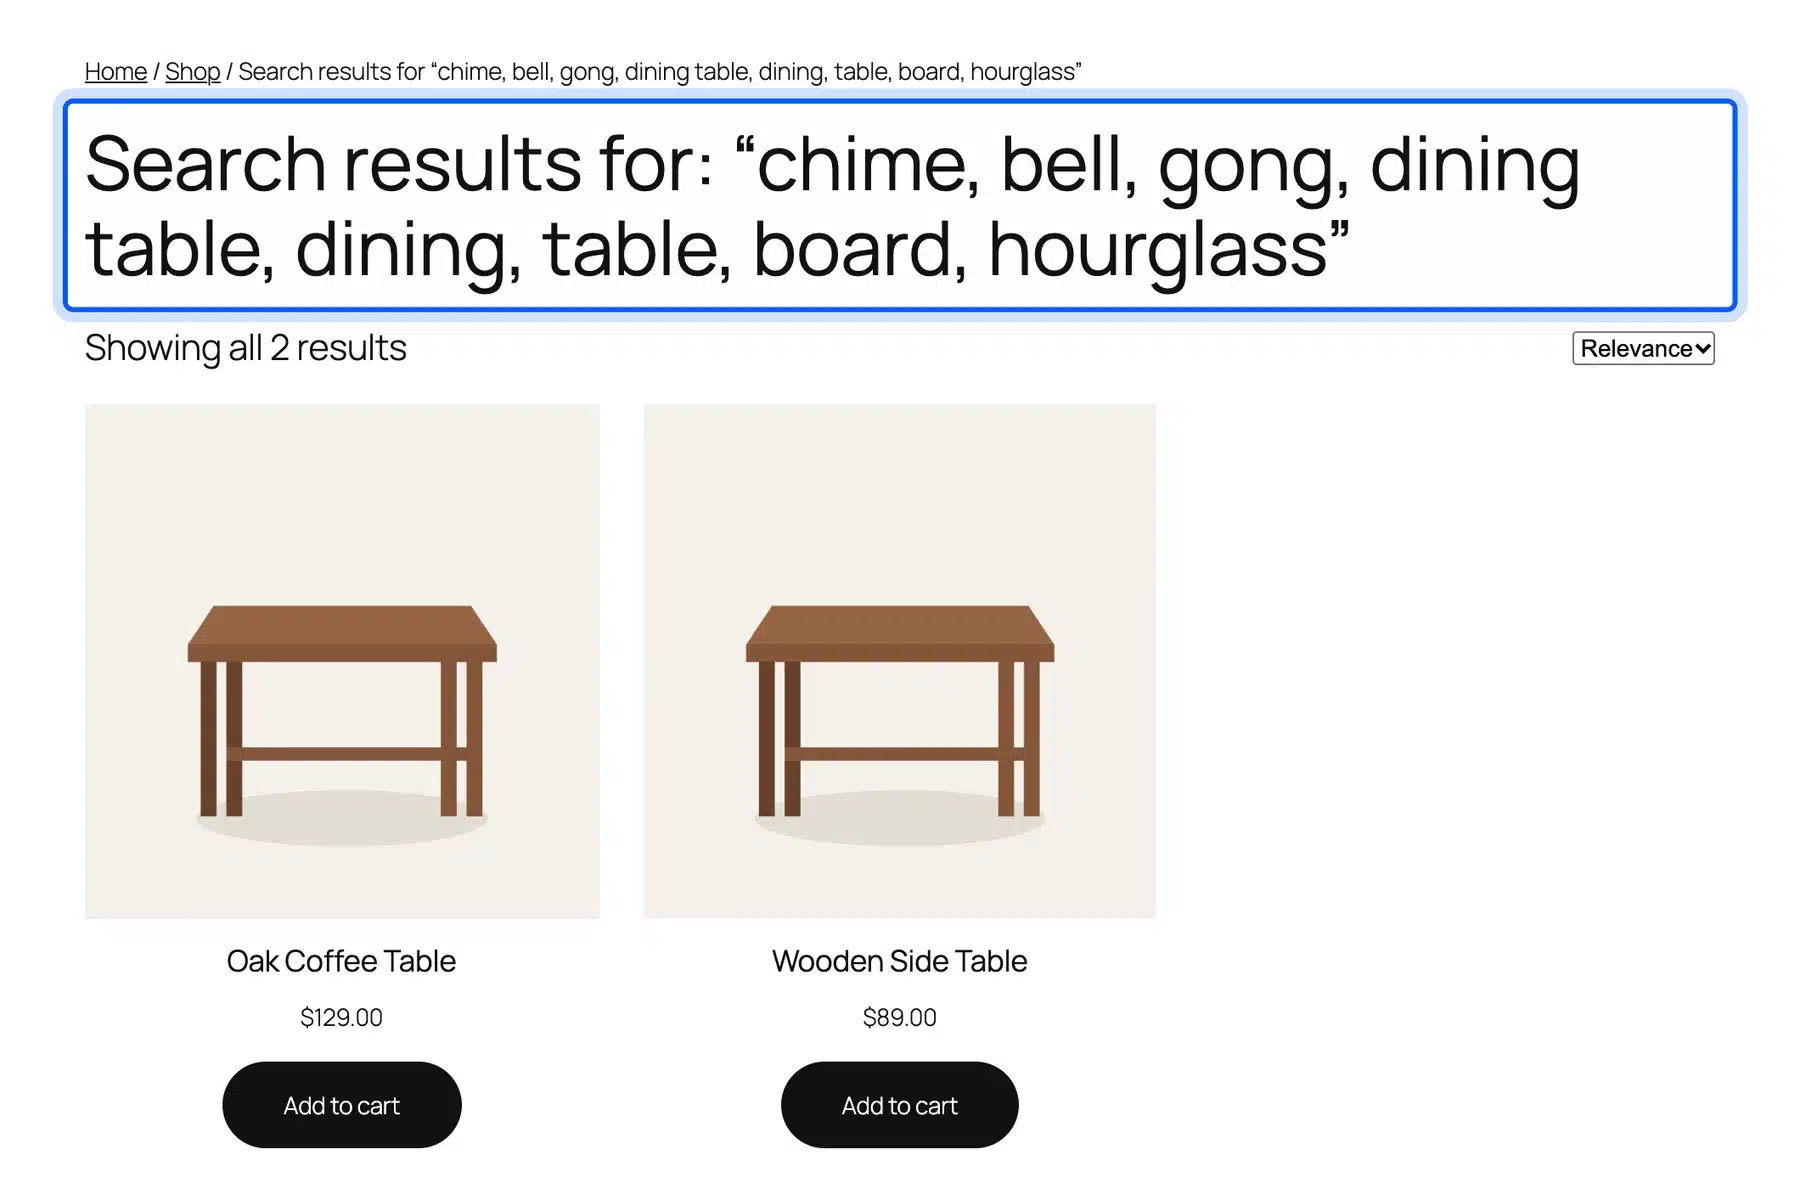
The results page listed Oak Coffee Table and Wooden Side Table, the two products with a table tag. Two things stood out.
Only dining table and table fit the photo. The AI keywords were rough.
With Search Type on Products Title the same photo found no products, even though both titles contain the word table. The first search also took more than 10 seconds because the browser downloaded the model. Add image tags before you rely on it.
Licenses start at $49 as of October 2026 on the product page. Our guide to adding a search bar in WordPress walks through the other options.
8. Test Offers Such as Free Gifts
A clear offer can give a shopper a reason to keep browsing. A free gift above a cart total is one example, but we found no source that proves gifts lower bounce rate. Treat it as a test and not a promise.
WooCommerce core cannot add a gift to the cart for you. Our guide to a WooCommerce free gift compares a coupon, a free plugin and a points reward. It also shows the math that keeps a gift from eating your margin.
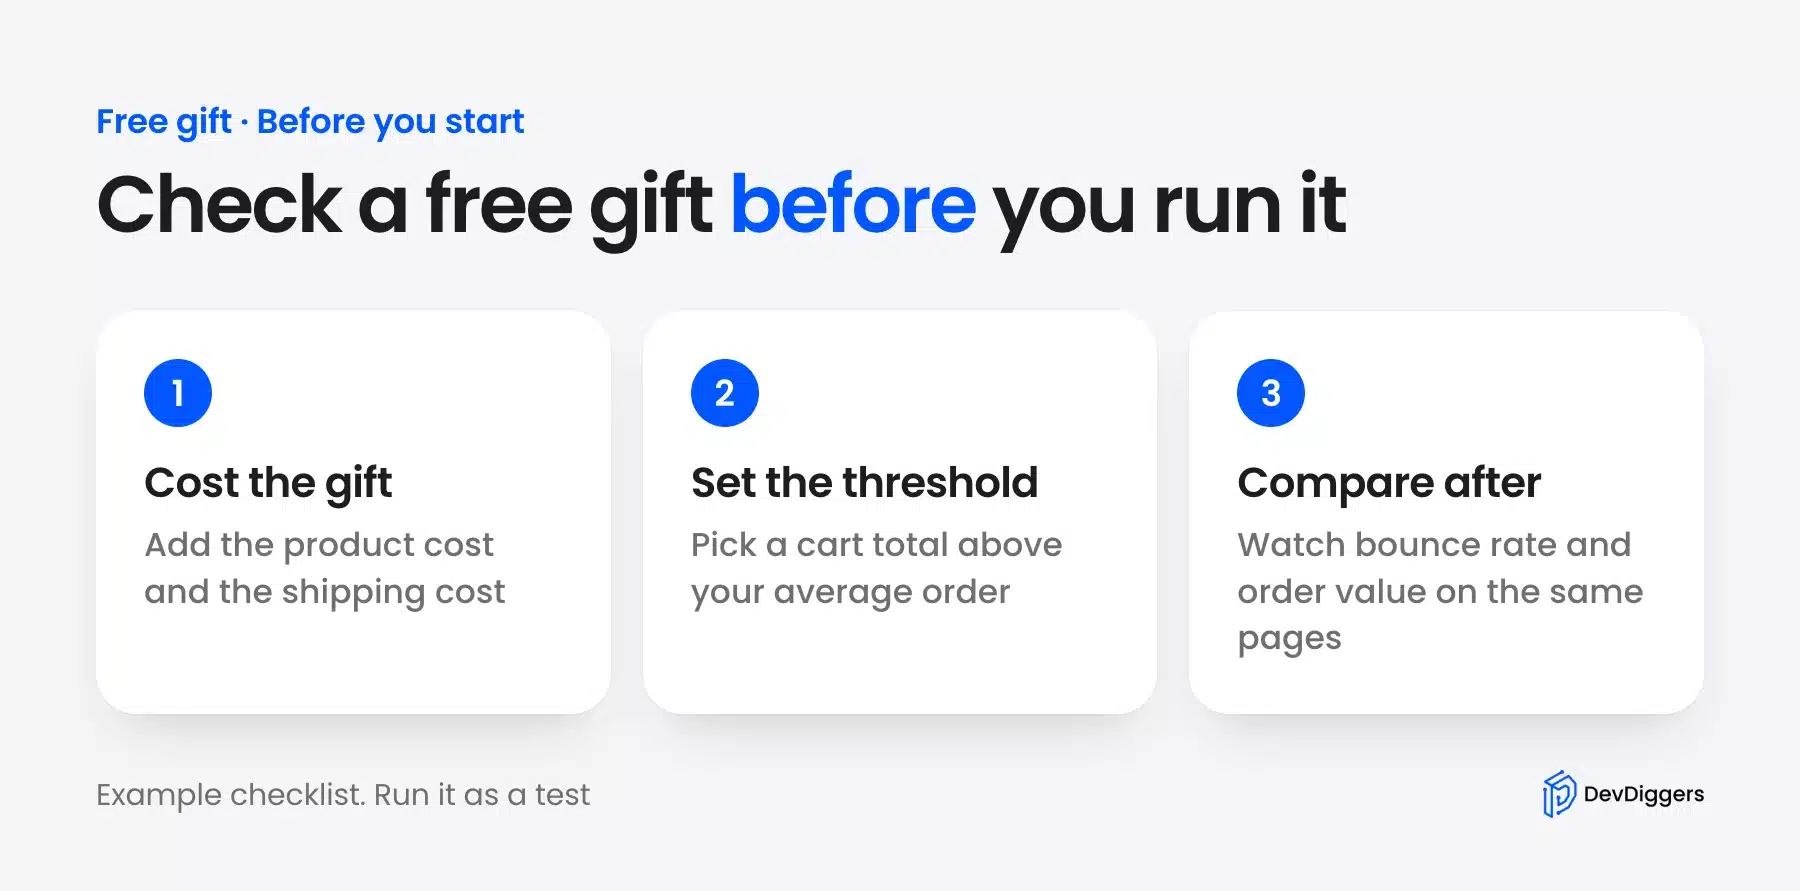
Cost the gift first with a worked example: say a $12 gift is offered above a $60 cart. A shopper at $55 might add a $10 item to reach it. Run the offer for a set period and compare the bounce rate on the same pages.
How to Tell If a Fix Worked
Change one thing at a time and compare the same page, device and traffic source before and after. Wait at least two full weeks so each weekday appears twice. GA4 reports a number but does not tell you whether a small gap is luck.
Here is a worked example with round numbers. Say 2,000 sessions land on one product page before a speed fix and 900 bounce for 45 percent. After the fix 2,000 sessions land and 780 bounce for 39 percent.
That is 120 fewer bounces and a 6 point drop. It looks good but check the traffic mix first. If a weak campaign paused in between, the number moved for another reason.
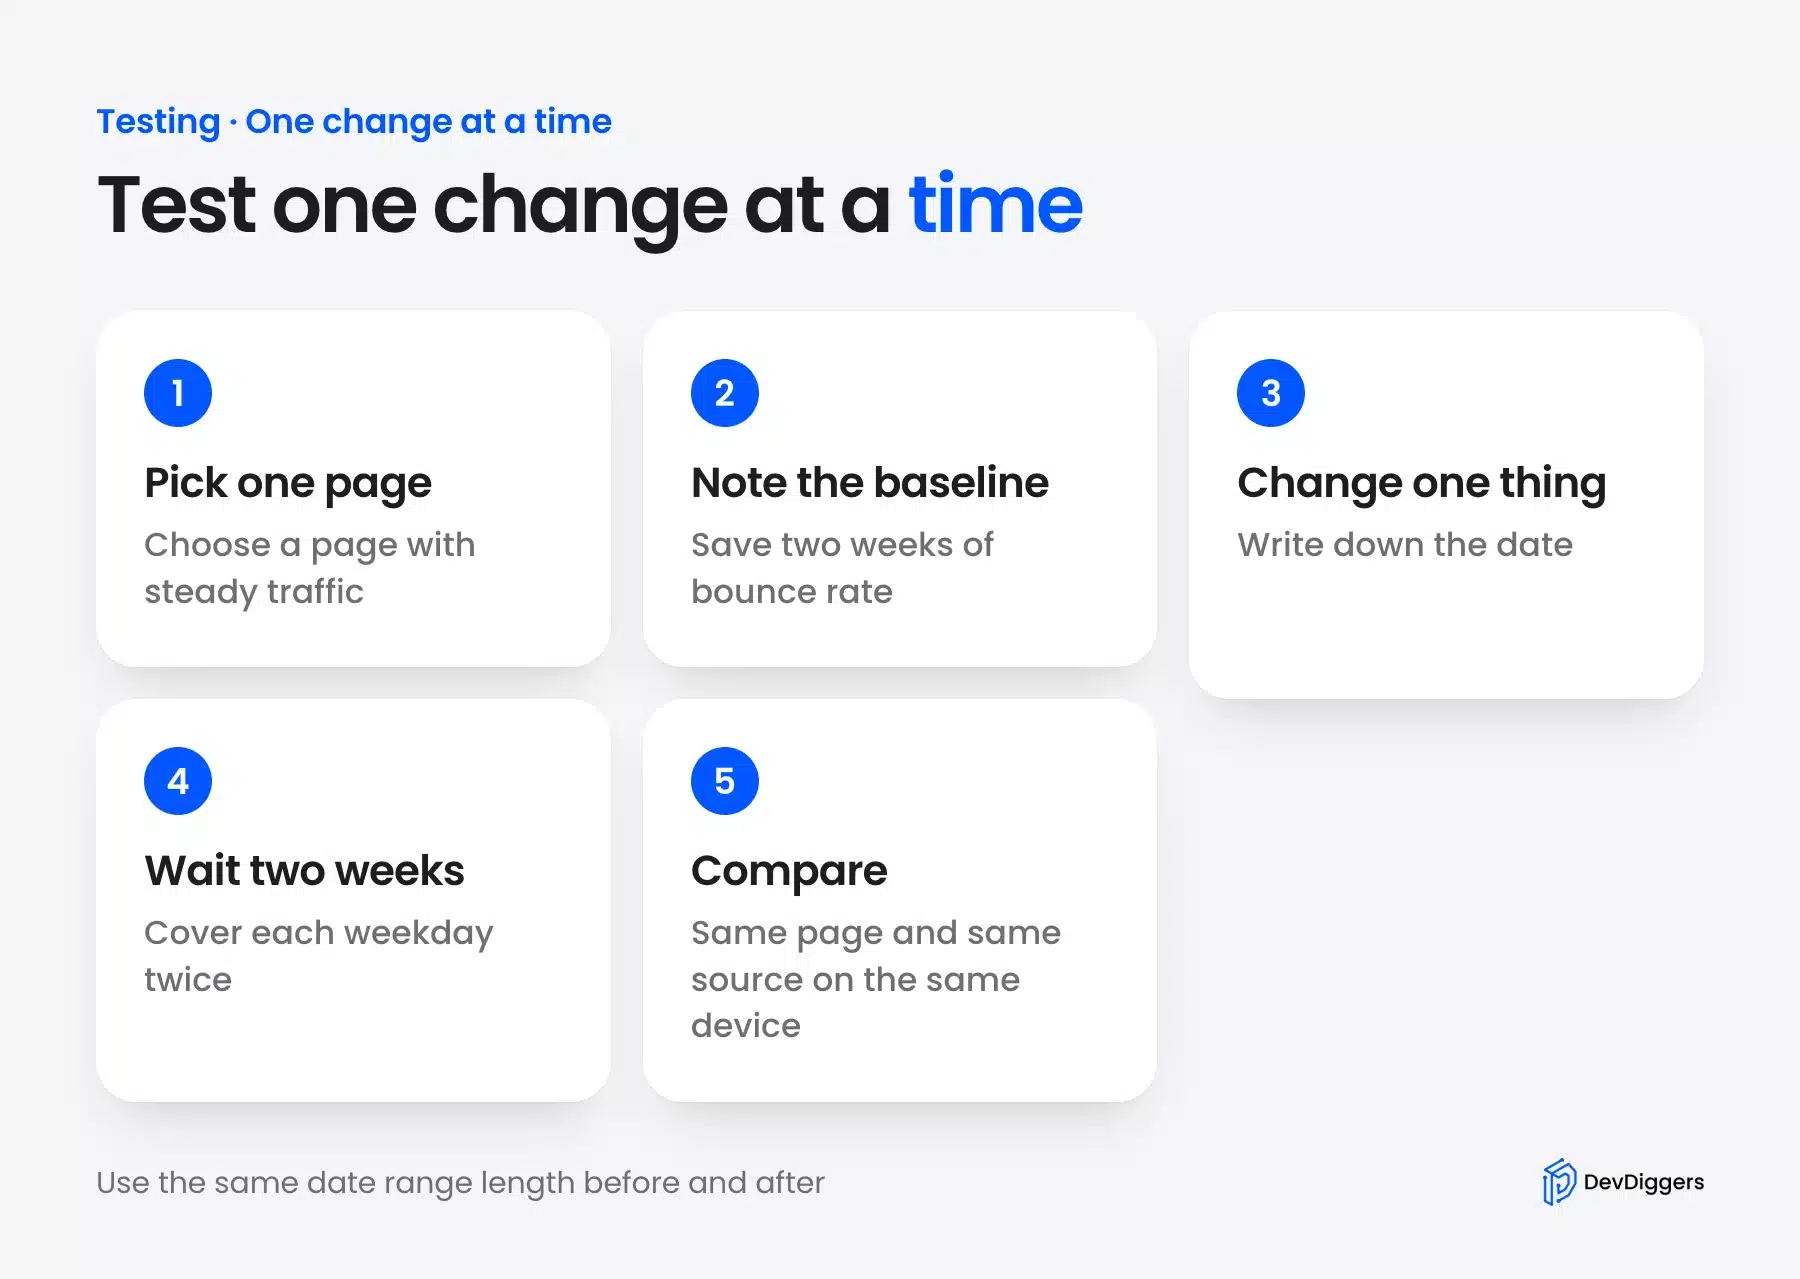
Write down each change with its date. Use the same date range length before and after. Our guide to adding a heatmap to a WordPress site shows how to see where shoppers stop.
GA4 shows which page bounces. A heatmap shows what the visitor did before leaving. Use both before you spend on a redesign.
When a High Bounce Rate Is Fine
A high bounce rate is fine on pages that answer one question. A reader who finds a store address or an order status in one visit is not lost. Blog posts and help pages often fit that pattern because the reader got the answer.
Judge a page by its job. A product page should lead to a cart. A contact page should lead to a message.
Also watch the next metric. A page with a high bounce rate and a good conversion rate is working. A page with a low bounce rate and no sales may confuse shoppers after the click. If sales are the problem, start with these eight tested conversion fixes for a store.
Conclusion
Knowing how to reduce bounce rate in eCommerce comes down to the GA4 definition and a few fixes tested one at a time. A bounce is a session that was not engaged. Fix the busy pages that carry paid or search traffic first.
Start with speed. Then show price and shipping early and match the landing page to the ad.
Make the phone layout easy to use and keep guest checkout on. Answer product questions and ease search after that. Compare the same page before and after each change.
If you want help with the work itself, our WooCommerce development services cover store changes and tuning. Our guide to eCommerce user experience goes deeper on layout and flow.
Frequently Asked Questions (FAQs)
Q1. How is GA4 bounce rate different from Universal Analytics?
Universal Analytics counted single-page sessions divided by all sessions, as Google’s legacy help page states. GA4 counts sessions that were not engaged. A long single-page visit was a bounce in the old report and is engaged in GA4.
Q2. Can I change the 10 second engaged session timer in GA4?
Yes. A web data stream has a setting called “Adjust timer for engaged sessions” on Google’s sessions page. You pick the number of seconds, but changing it breaks comparison with older data.
Q3. How do I reduce bounce rate in Google Analytics?
You cannot reduce it inside GA4 because the tool only measures. Change the site and watch the number. Moving the engaged session timer lowers the figure but changes the definition and does not change shopper behavior.
Q4. Does a high bounce rate mean my store is losing sales?
Not always. A bounce on a page that answers one question, such as a store address, is a success. A high bounce rate on a busy product page that gets paid traffic is the one to worry about.
Q5. How long should I wait before judging a change?
Wait at least two full weeks so every weekday appears twice. Compare the same page, device and traffic source. A shorter test can mix in a sale or a paused campaign.
Q6. What is a good engagement rate in GA4?
Google’s engagement rate definition is the percentage of engaged sessions. Google gives no target. Compare your product pages with each other and with your own past months.
Q7. Does bounce rate show in WooCommerce Analytics?
WooCommerce Analytics reports on your orders and products. GA4 reports bounces and engagement. Use GA4 to find pages that lose visitors and WooCommerce to see the sales that follow.