Your LoyaltyX dashboard is the gateway to understanding how your loyalty program is performing. Nonetheless, most store owners barely dive into any of the data presented. In this guide, we provide you with the knowledge to become more than just an occasional user of your LoyaltyX dashboard and instead, a data-driven loyalty strategist.
Learn how to read every metric, use useful charts, and make decisions that lead to higher retention rates and customer lifetime value.
How to Get to Your LoyaltyX Dashboard #
You can access your dashboard in 2 ways:
- Go to your WordPress Admin and navigate to DevDiggers Plugins → LoyaltyX → Dashboard.
- Direct link: wp-admin/admin.php?page=ddwcpr-dashboard.
The dashboard will load without delay and the metrics contained inside will be based on real-time data about your loyalty program.
Dashboard Overview #
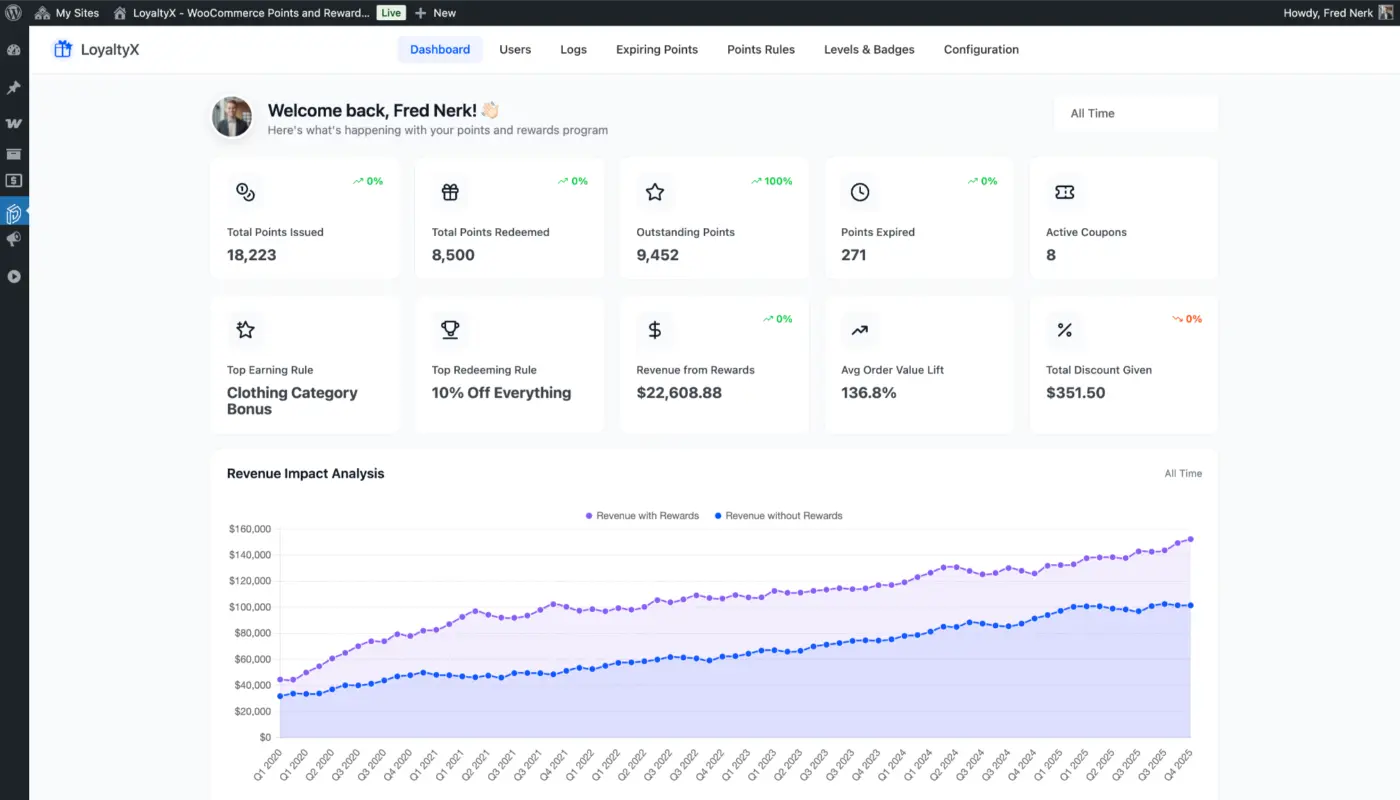
The top of the dashboard provides you with a personalized welcome and a date range filter. You can adjust the reporting date range to “Today”, “This Week”, “This Month”, “This Year”, or select a custom date range.
This filter applies to all metrics in the dashboard so you can easily compare between time periods.
Explanation of Key Performance Metrics #
1. Points Issued
The total points issued metric indicates all of the points given to customers during your selected time period. The percentage metric shows if any changes occurred in comparison to the previous period.
What this tells you:
- Level of engagement with the program
- If the points earning rules are driving engagement
- Seasonal trends of customer activity
2. Points Redeemed
Tracks how many points customers redeemed for rewards. Higher redemption of points signifies that your customers find enough value in your rewards.
What this tells you:
- How appealing your rewards are
- Whether your customers are satisfied with the rewards presented to them
- If your point value issued is comparable to the applicable value
3. Points Outstanding
The total points customers have in their accounts. This is your “loyalty liability,” or what you owe customers.
What this tells you:
- The current health of your loyalty program (if this remains high, customers are not redeeming points.)
- What a discount may mean for your revenue over the course of a given time period
- If your expiration policy is meaningful ( and working)
4. Points Expired
Points that have been removed from customers’ accounts due to your expiration policy.
What this tells you:
- If your expiration policy is effective
- What times of the year do your customers engage with the program
- If customers are notified regarding their points
5. Active Coupons
Counts the number of active redemption coupons that customers have not redeemed yet, which are still valid.
What it tells you:
- Redemption momentum
- Conversion of a coupon to purchase
- Typically, the ideal expiration of the coupon
6. Top Earning Rule
This metric tells you which earning rule provides the most points to customers, which is typically your base purchase rule.
What it tells you:
- Which base (or default) incentives drive customer engagement?
- Whether you need to modify the reward type.
- Some patterns of earning engagement tendencies.
7. Top Redeeming Rule
This metric tells you which reward redemption rule is the most popular with customers.
What it tells you:
- Which reward do your customers value most and what should you encourage more promotions of?
- If you should develop more redemption rules that have a similar prize or value.
8. Revenue From Rewards
This tracks the total order value from customer transactions where points have been redeemed.
What it tells you:
- Reward return on investment.
- If or how to situate points for customers to create engagement.
- How much additional revenue has the program generated?
9. Average Order Value Lift
This metric compares the average order value of purchases between customers who earned and redeemed rewards and customers who did not redeem rewards.
What it tells you:
- The program is effective.
- If the rewards program generates incremental revenue or increases purchase value vs those who have no activity in the reward program.
10. Total Discount Given
The total of all discounts made via point redemptions.
What it tells you:
- Cost of your program
- Sustainability of your discount
- Whether your current program structure holds a margin
Dashboard Charts Explained #
1. Revenue Impact Analysis Chart
A dual-line chart showing “Revenue with Rewards” and “Revenue without Rewards” over time.
Read the graph:
- When the purple line (with rewards) is above the blue line (without rewards), this means a positive impact
- If the gap between the lines is widening over time, then the program is becoming more effective
- If the two lines are converging to a point, then the impact of the program is declining
How to Use: Identify time horizons when rewards drove the most lift. Try and recreate those circumstances.
2. Points Performance Chart
This is also a dual-line chart showing Points Earned in blue and Points Redeemed in pink.
Healthy patterns:
- Both lines trending upward = growing engagement levels
- Both lines remaining parallel to one another over time = an appropriate balance of earning and redemption
- Points redeemed climb quicker than Points earned = finding value
Red flags:
- Points Earned chart is flat = stopped engaging
- There is a large gap between lines of redeemed points and earned points = problem with redemption
- Points redeemed are a downward-trending line over time = problem with rewards
3. Earning Sources Breakdown Pie Chart
A pie chart showing the size of the different earning methods that accumulate points.
What to look for:
- The biggest slices will show your top engagements
- If you see little tiny slivers of earnings, then it means those rules probably don’t work very well!
- The pie is evenly distributed = broad engagement across earning methods
What to Do with Your Data: If you are seeing tiny slices, i.e., like six percent, the methods are not generating the behaviors you want to see. Increase the value of points for that activity and see if behaviours improve.
Recent Activities Section #
This real-time feed reflects:
- Customer names (linking to profiles)
- Type of activities (Order Complete, Fixed Discount, etc.)
- Points earned or redeemed (+185, -200)
- Transaction dates
- Related order numbers (clickable)
Use application:
- Track program adoption
- Identify your power users
- Identify glitches in the pattern
- Verify the rules work properly
Top Customers Panel #
Meet your loyalty program leaders, top customers a.k.a. your sphere of influence:
- Customer avatars
- Customer names (link to detailed views)
- Current point balances
- Loyalty levels
Why it Matters: Top customers usually represent 40-50% of the value of the loyalty program. Do something special for them!
Pro Tip: Create VIP earning rules exclusively for your top customers to entice and grow loyalty.
Purposefully Using Date Range Filters #
- Comparing week over week: The most formal way to show immediate changes to the loyalty program.
- Monthly review: To assess seasonal patterns and design for next year’s schedule.
- Quarterly review: A long-term process for assessing multiple months of data.
- Year over year: Measurement for growth and maturity of the loyalty program.
Advanced Tip: Take screenshots of the important metrics every month, then have a visual timeline at the end of the year for tracking the evolution of the program over time.
Following Steps #
Since you know what the dashboard is telling you, it is time to configure your program for maximum effectiveness.
Head to Configuring General Settings to get order statuses, point awarding rules, and My Account set up.
The more you configure these settings, the more actionable your dashboard metrics will be.