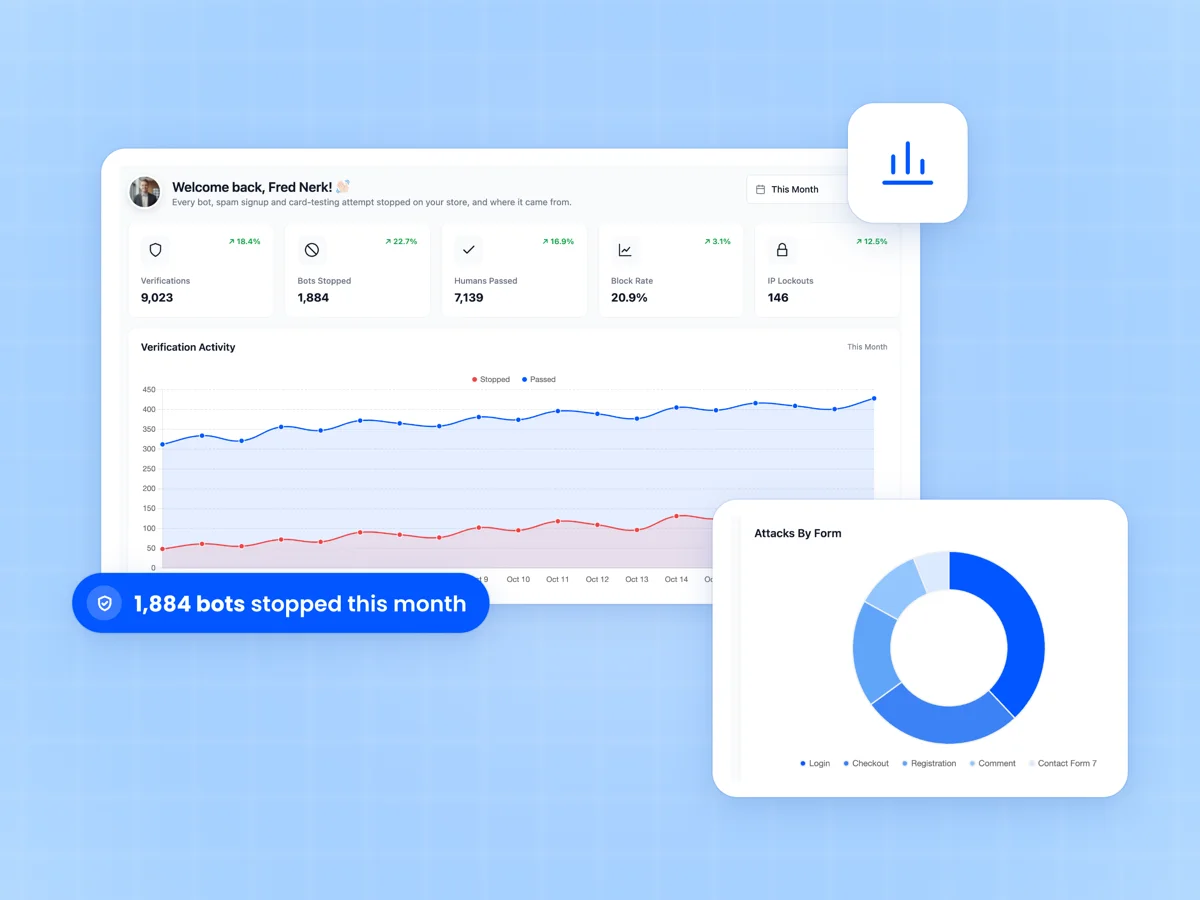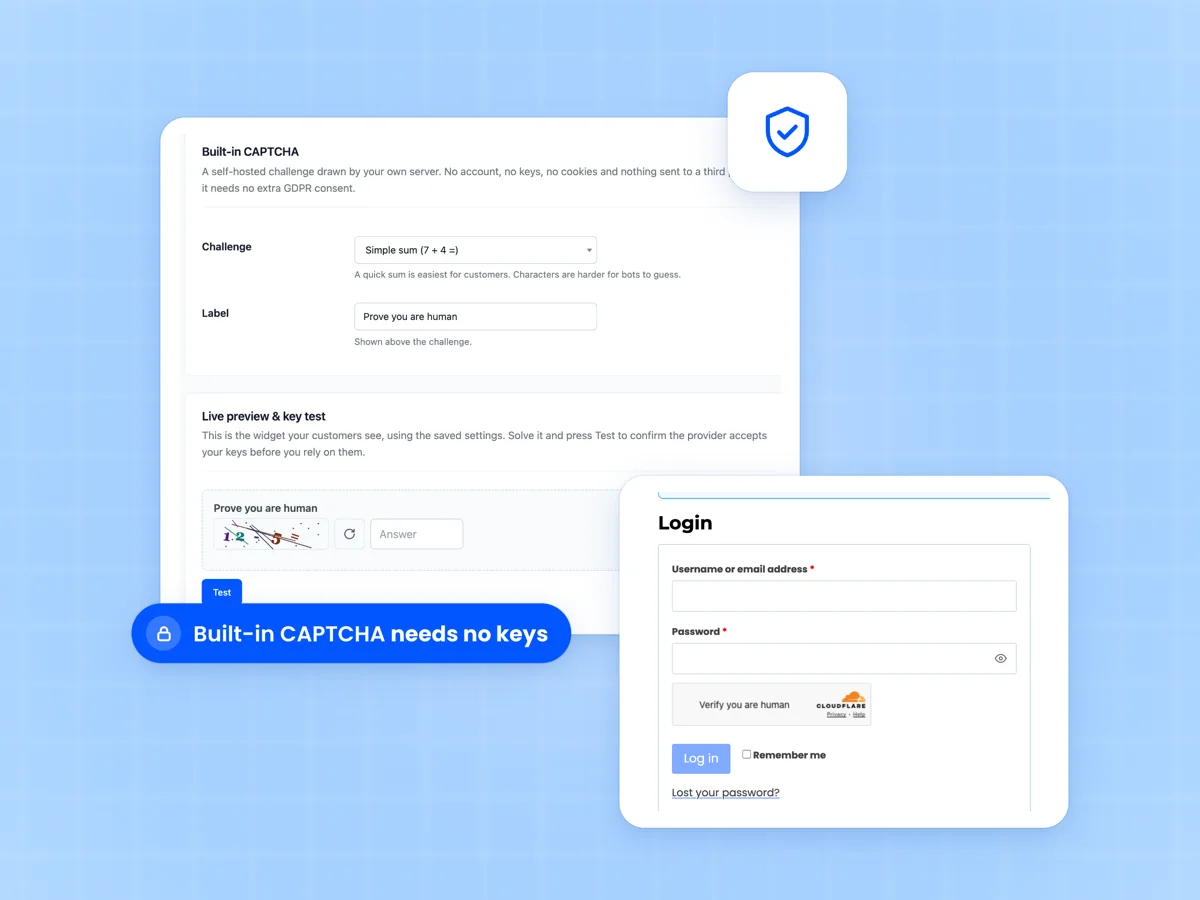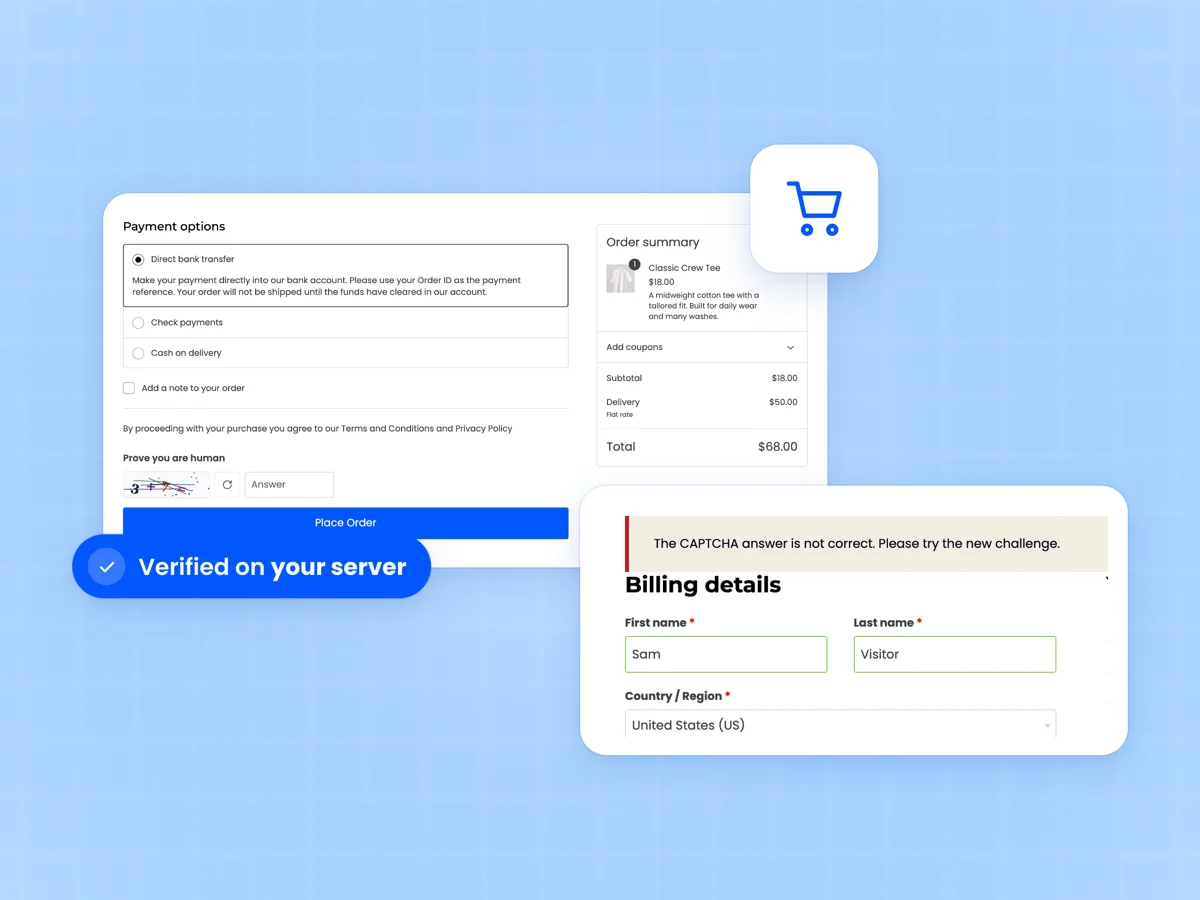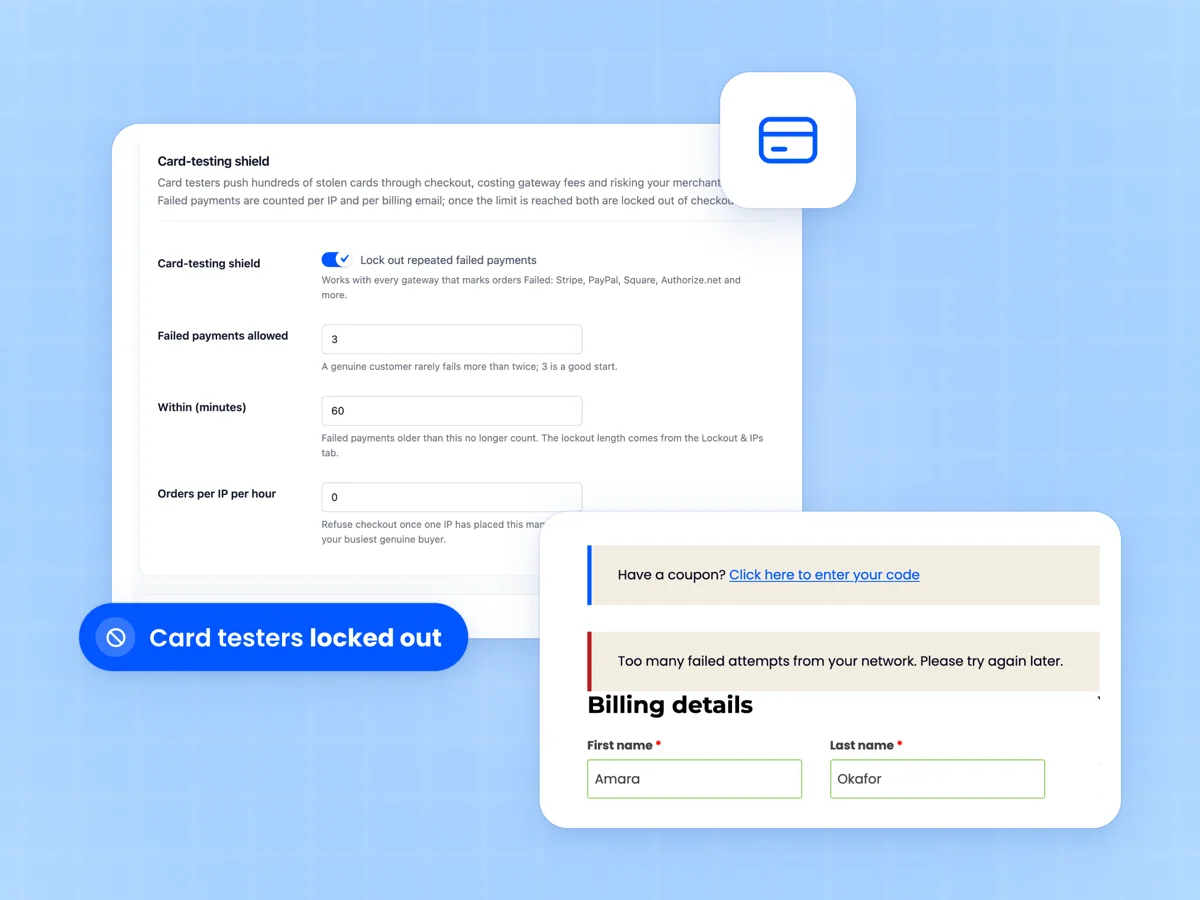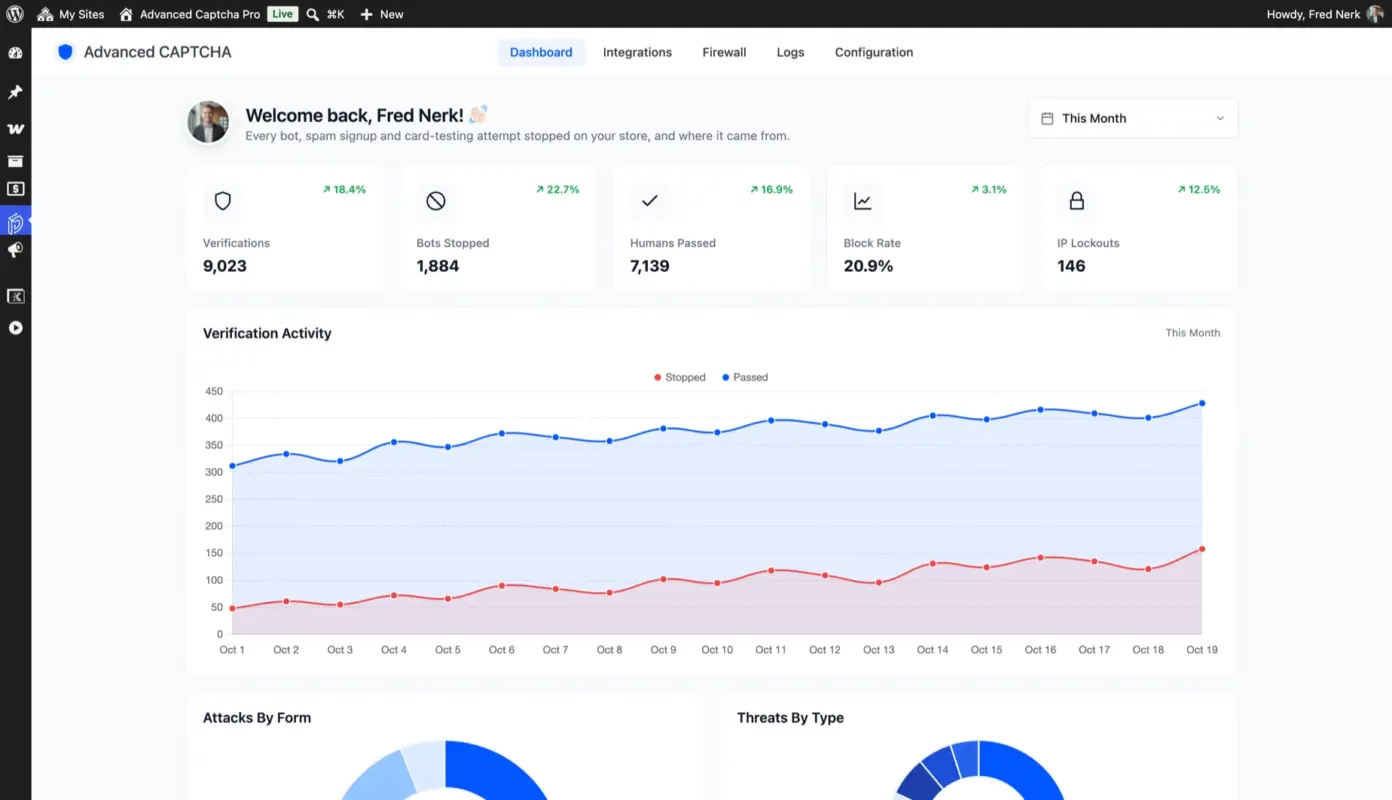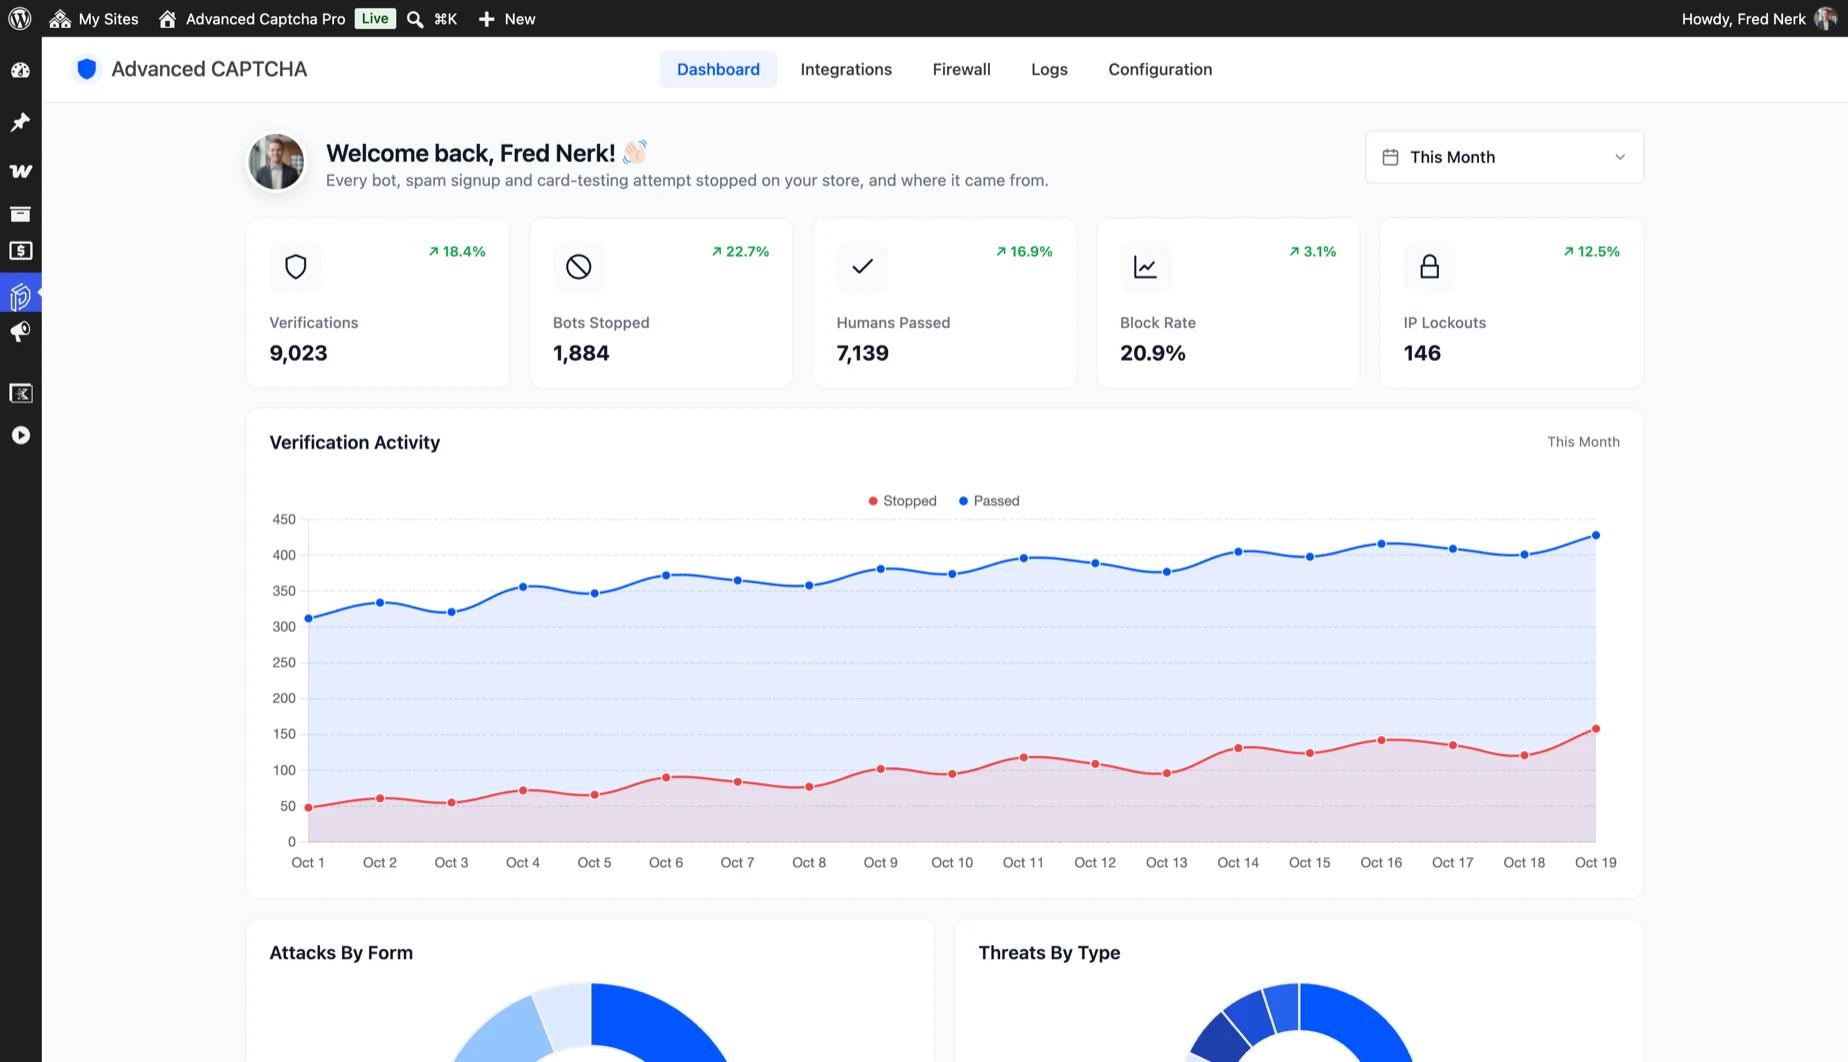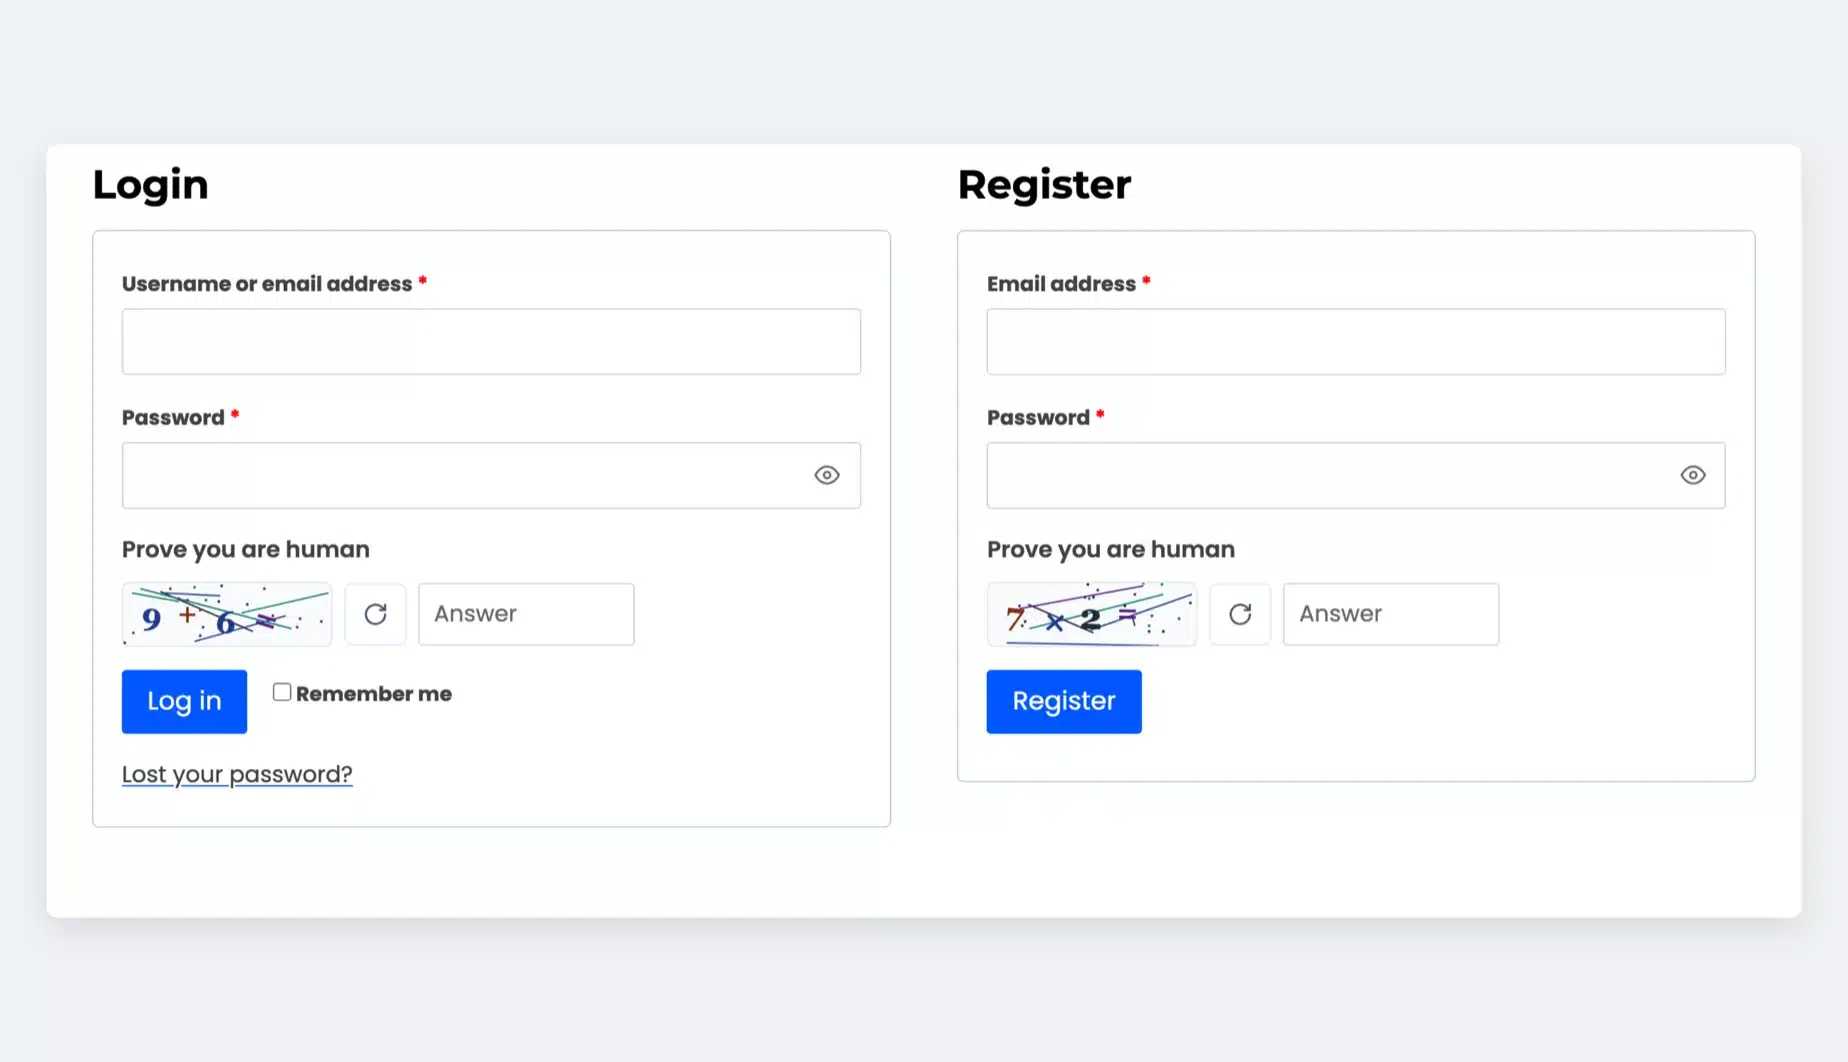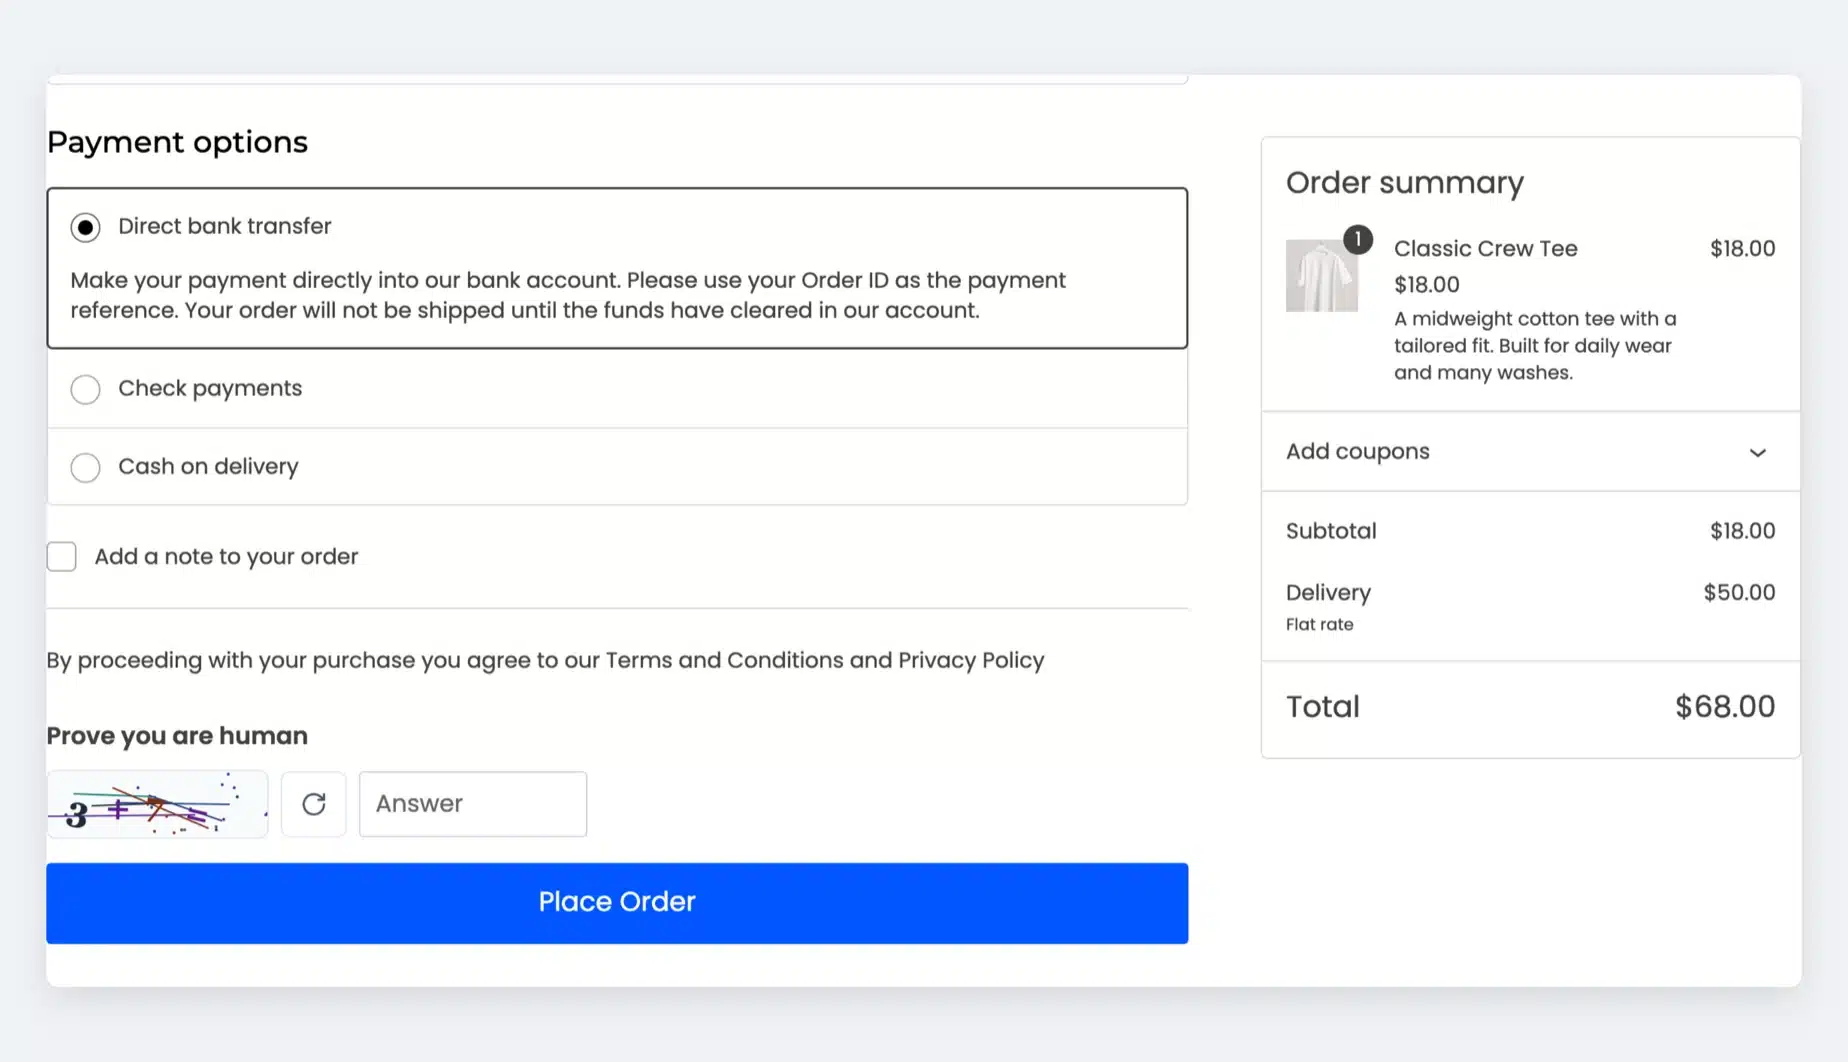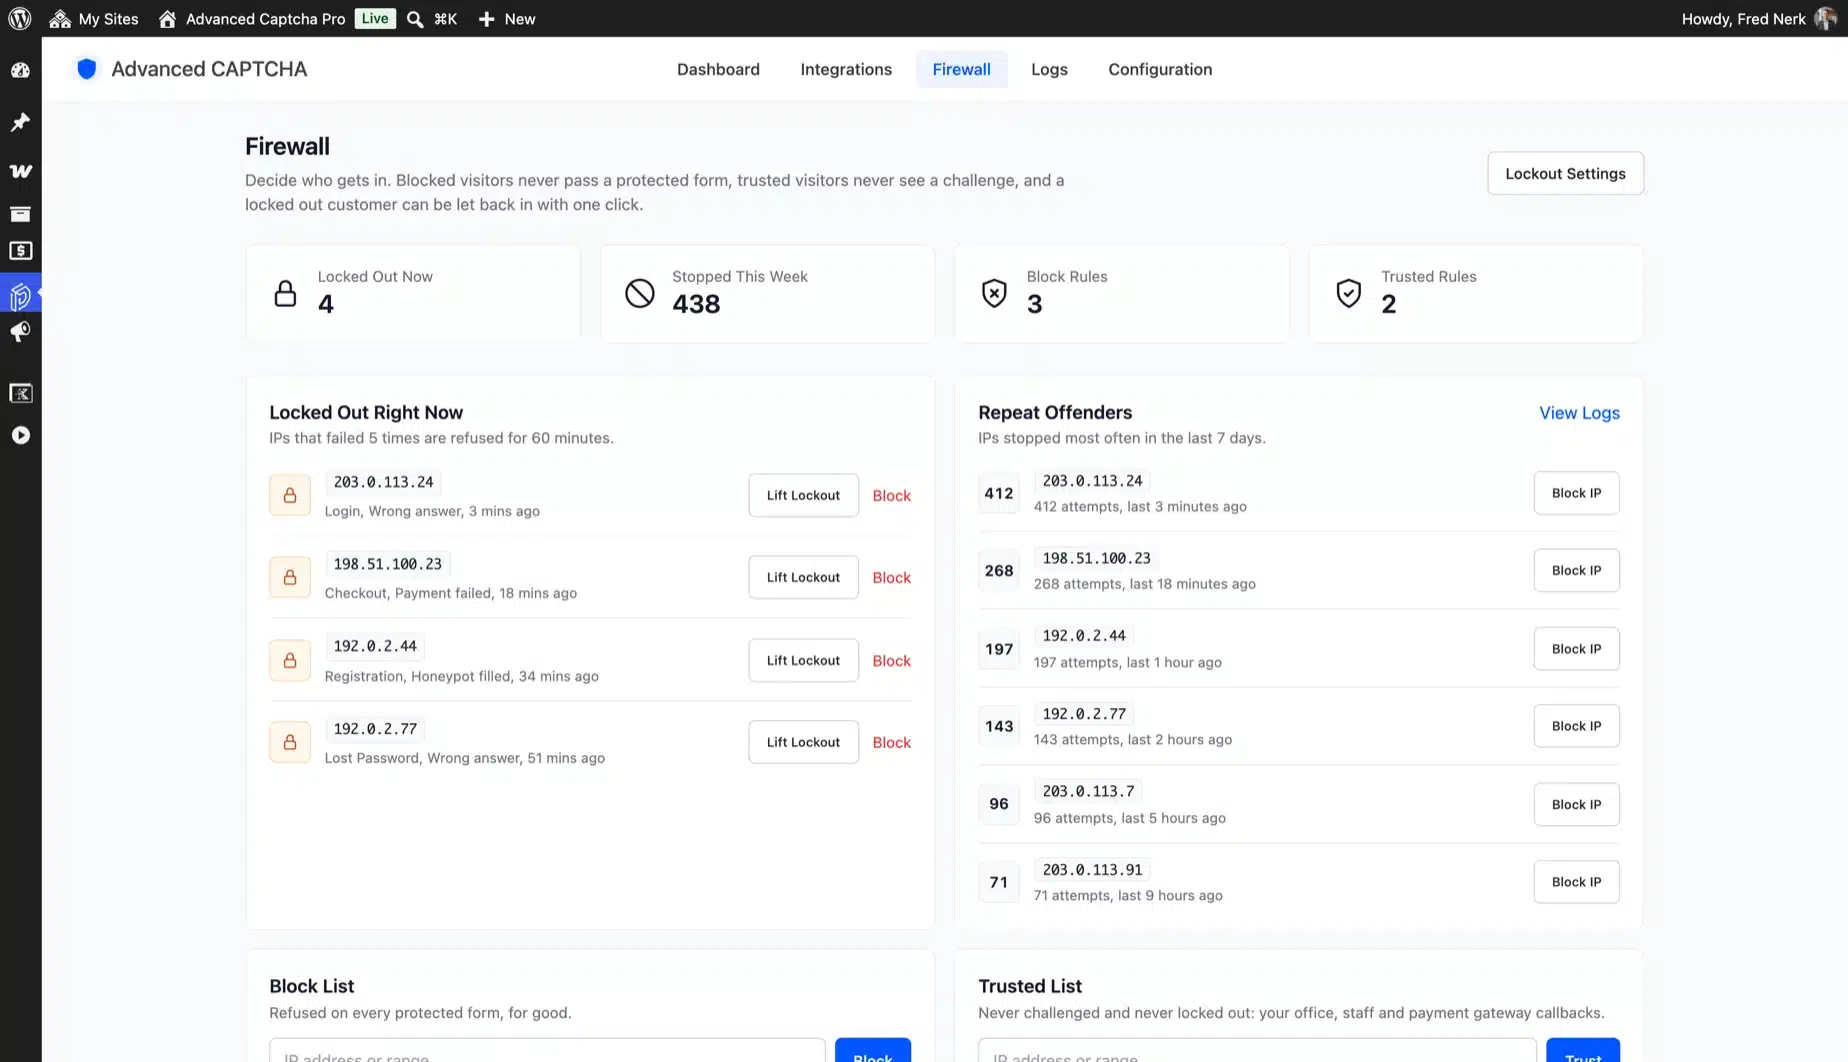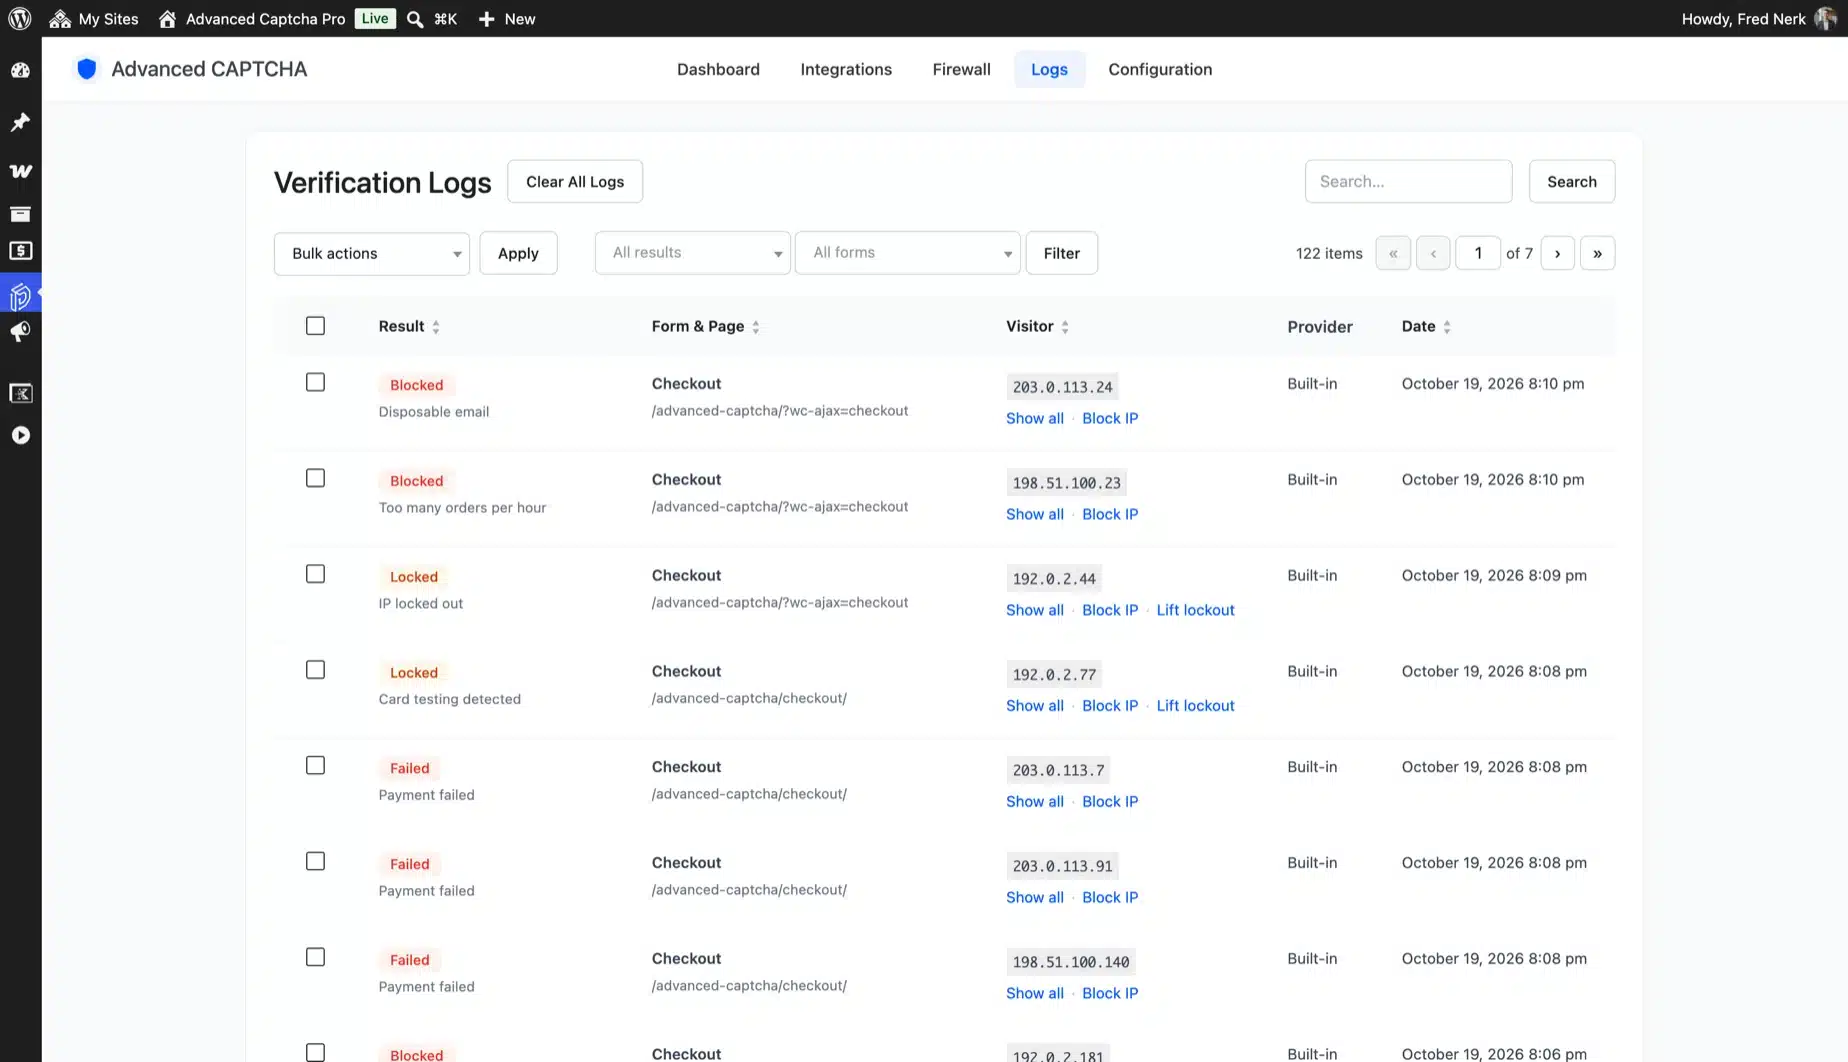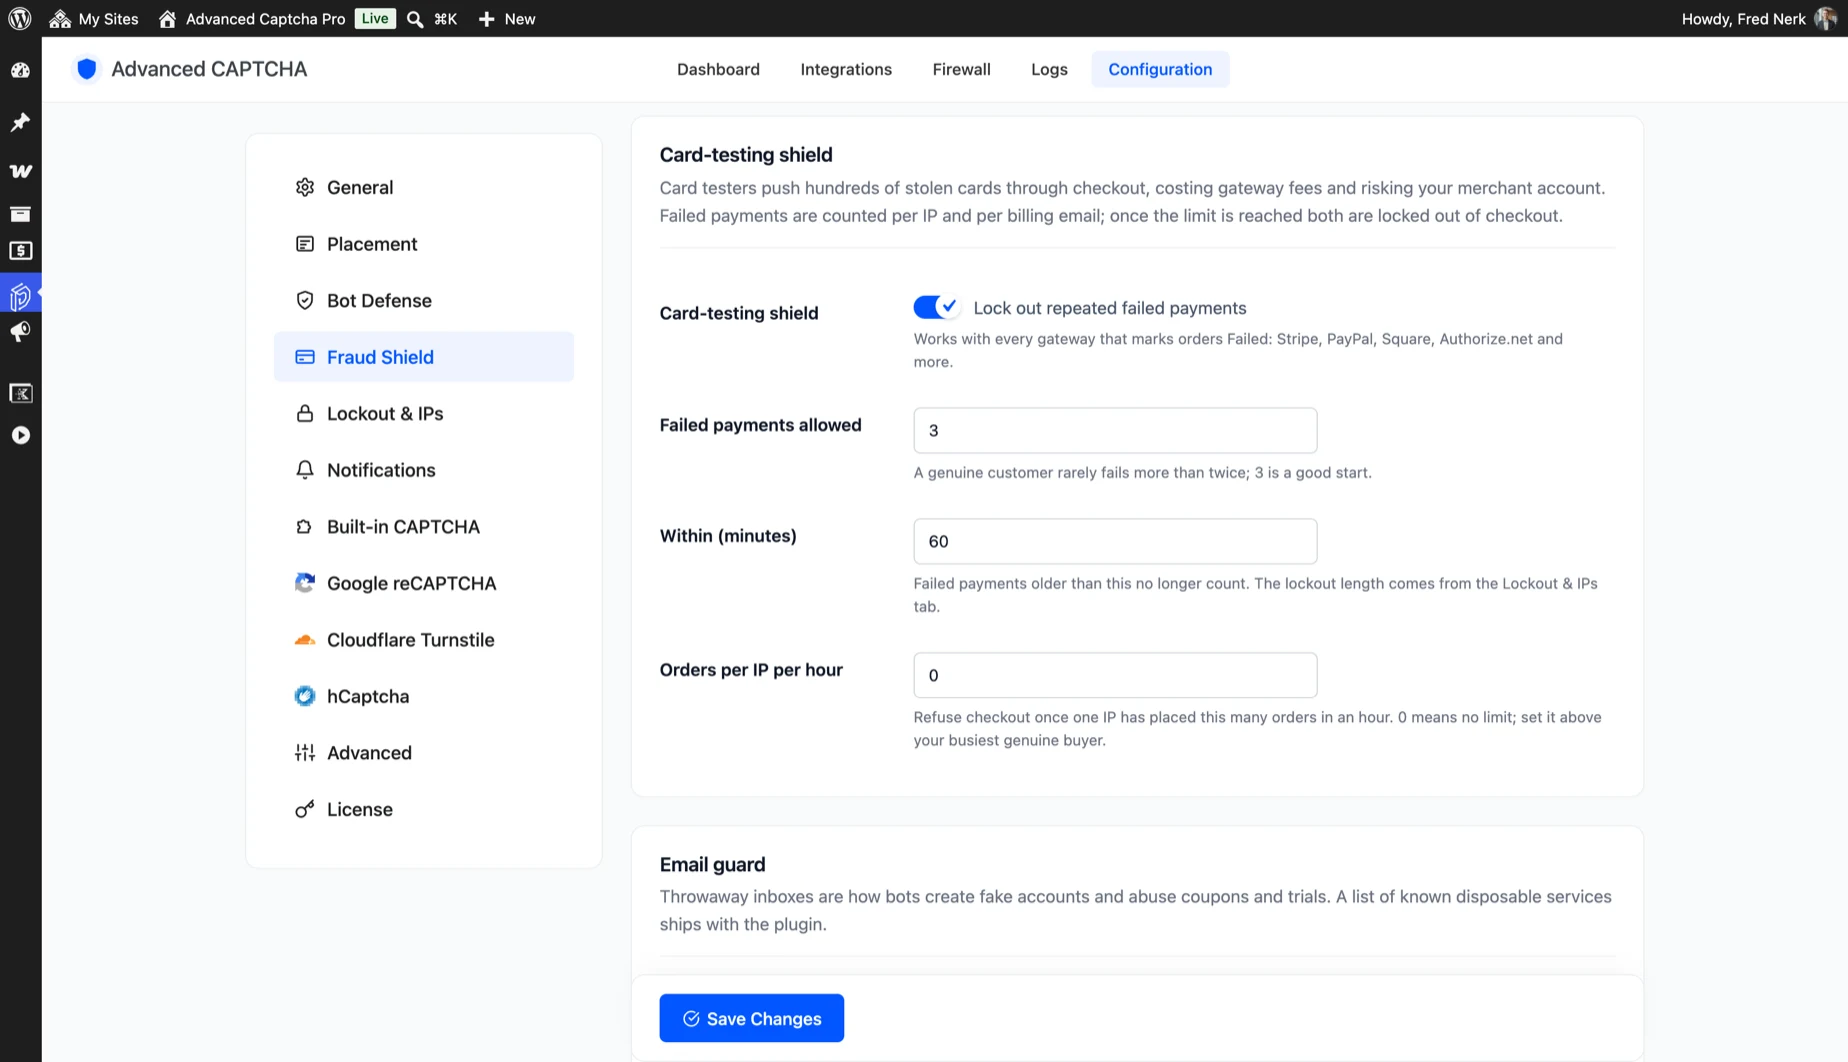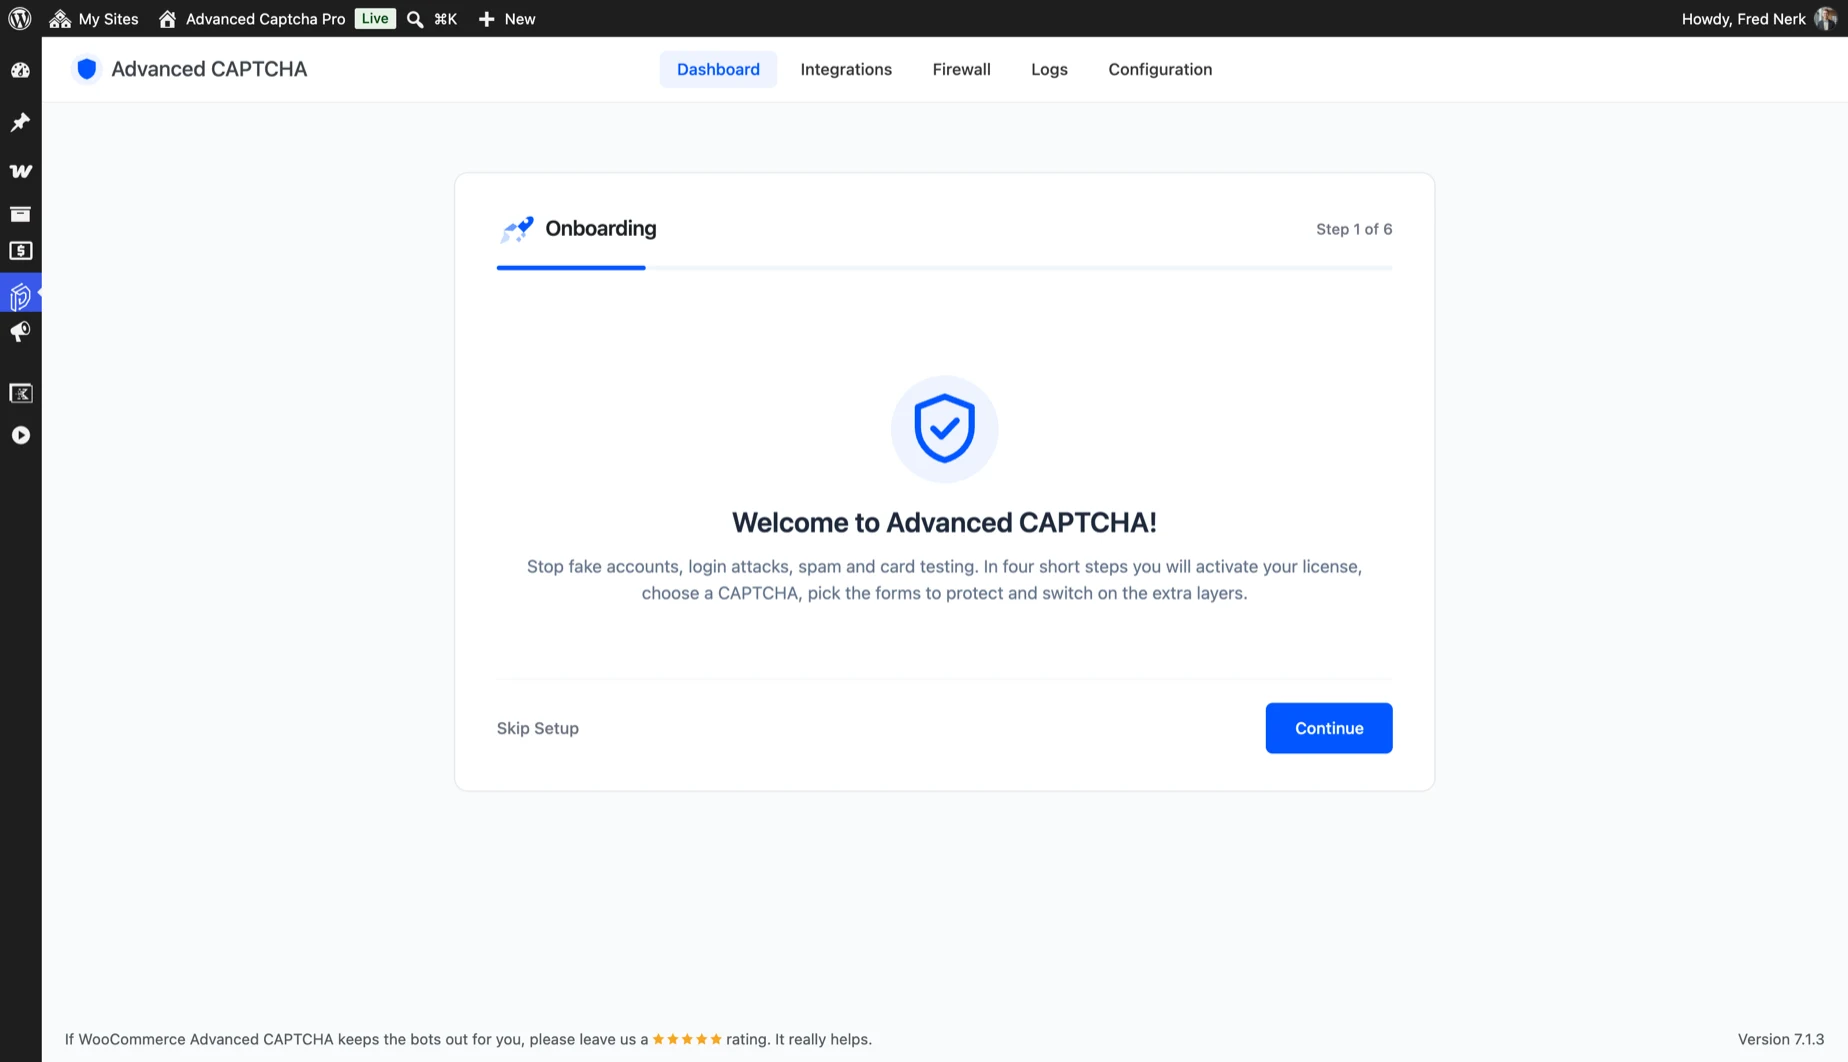


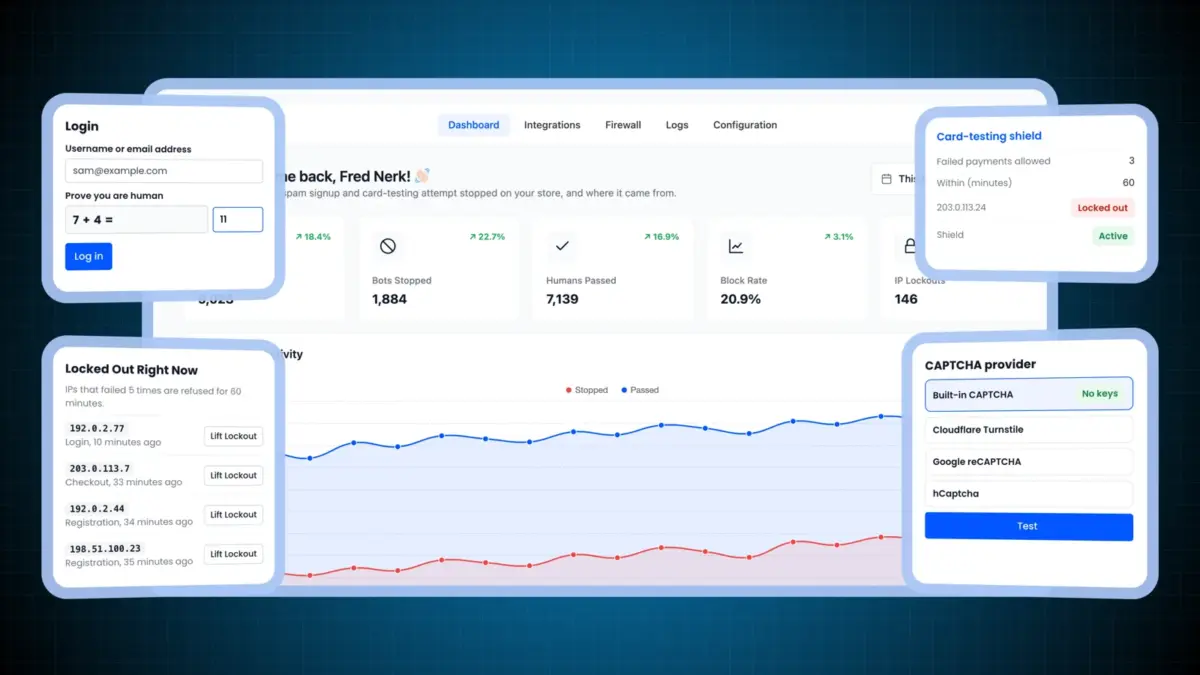






A security dashboard that shows what was stopped
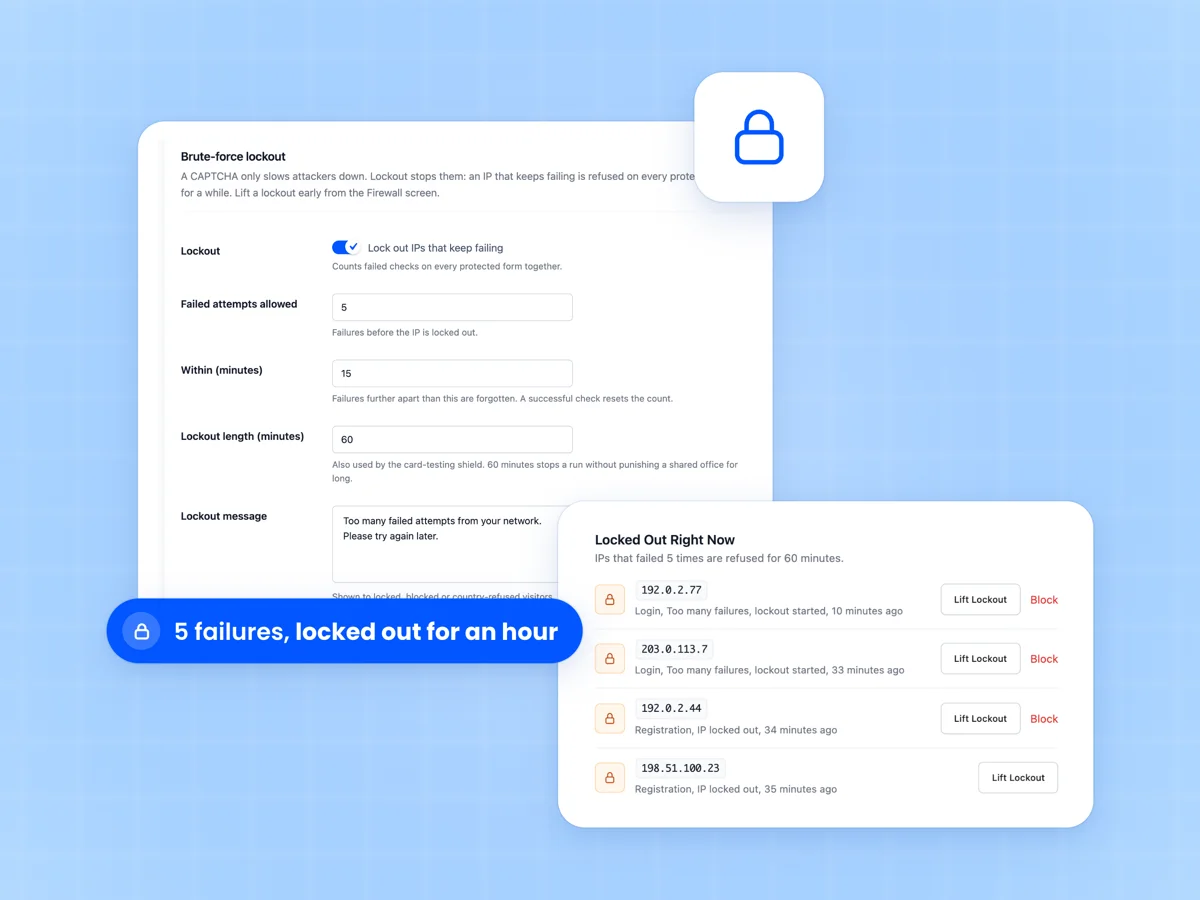
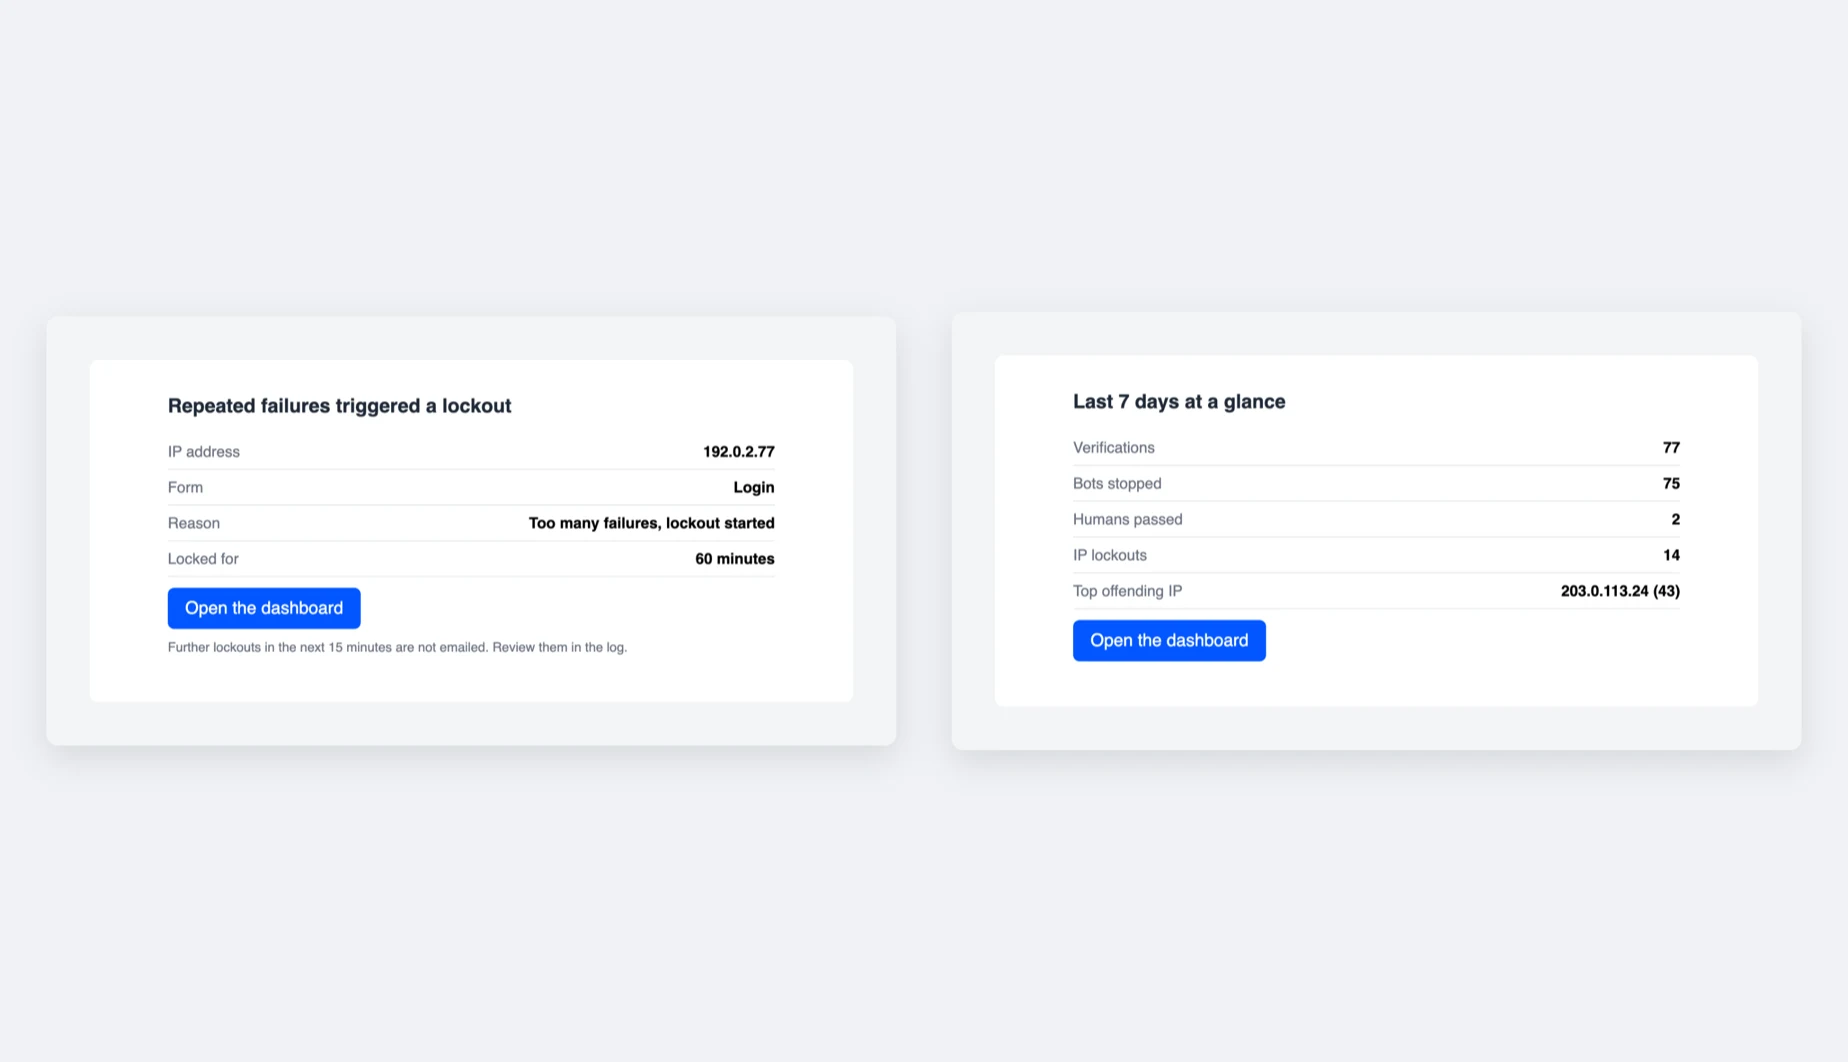
See verifications, bots stopped, humans passed, block rate and IP lockouts against the previous period. An activity chart shows when attacks came.
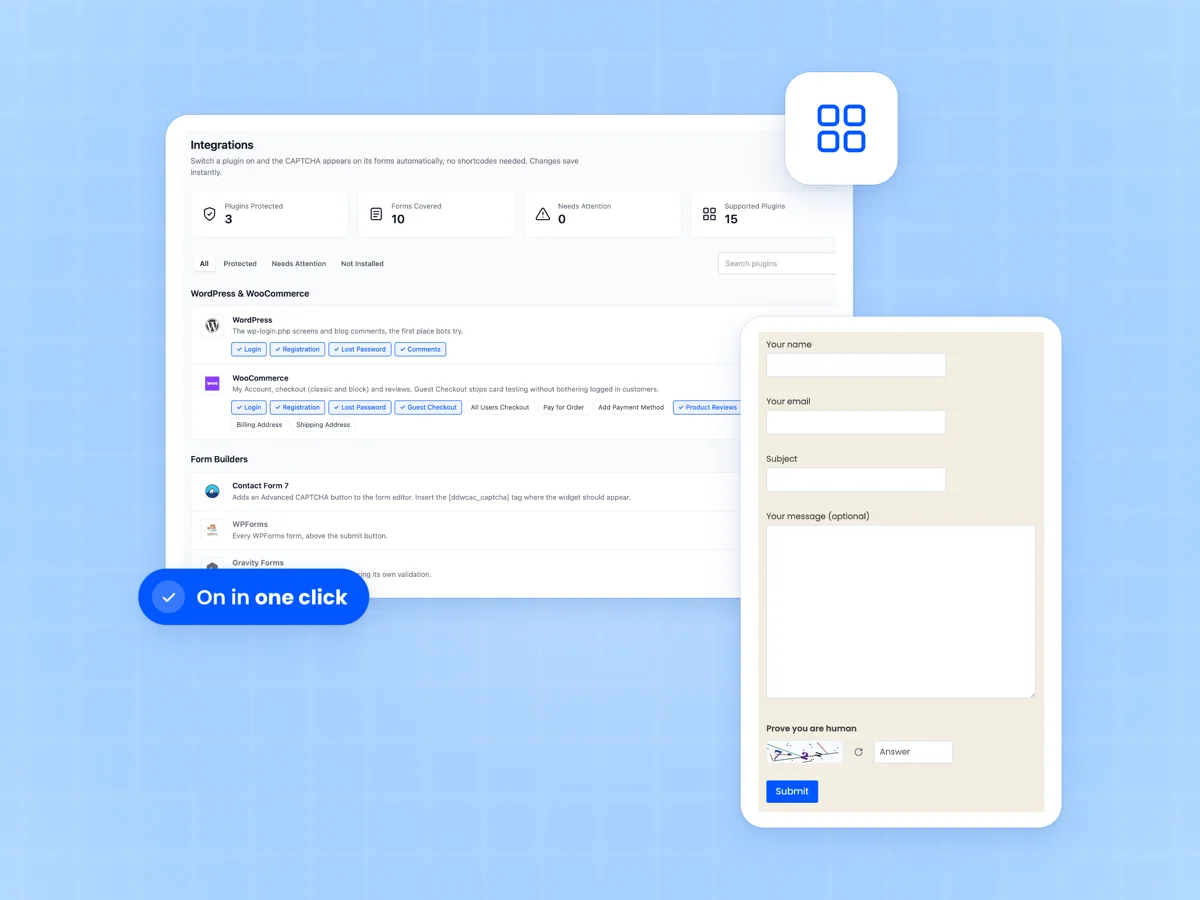
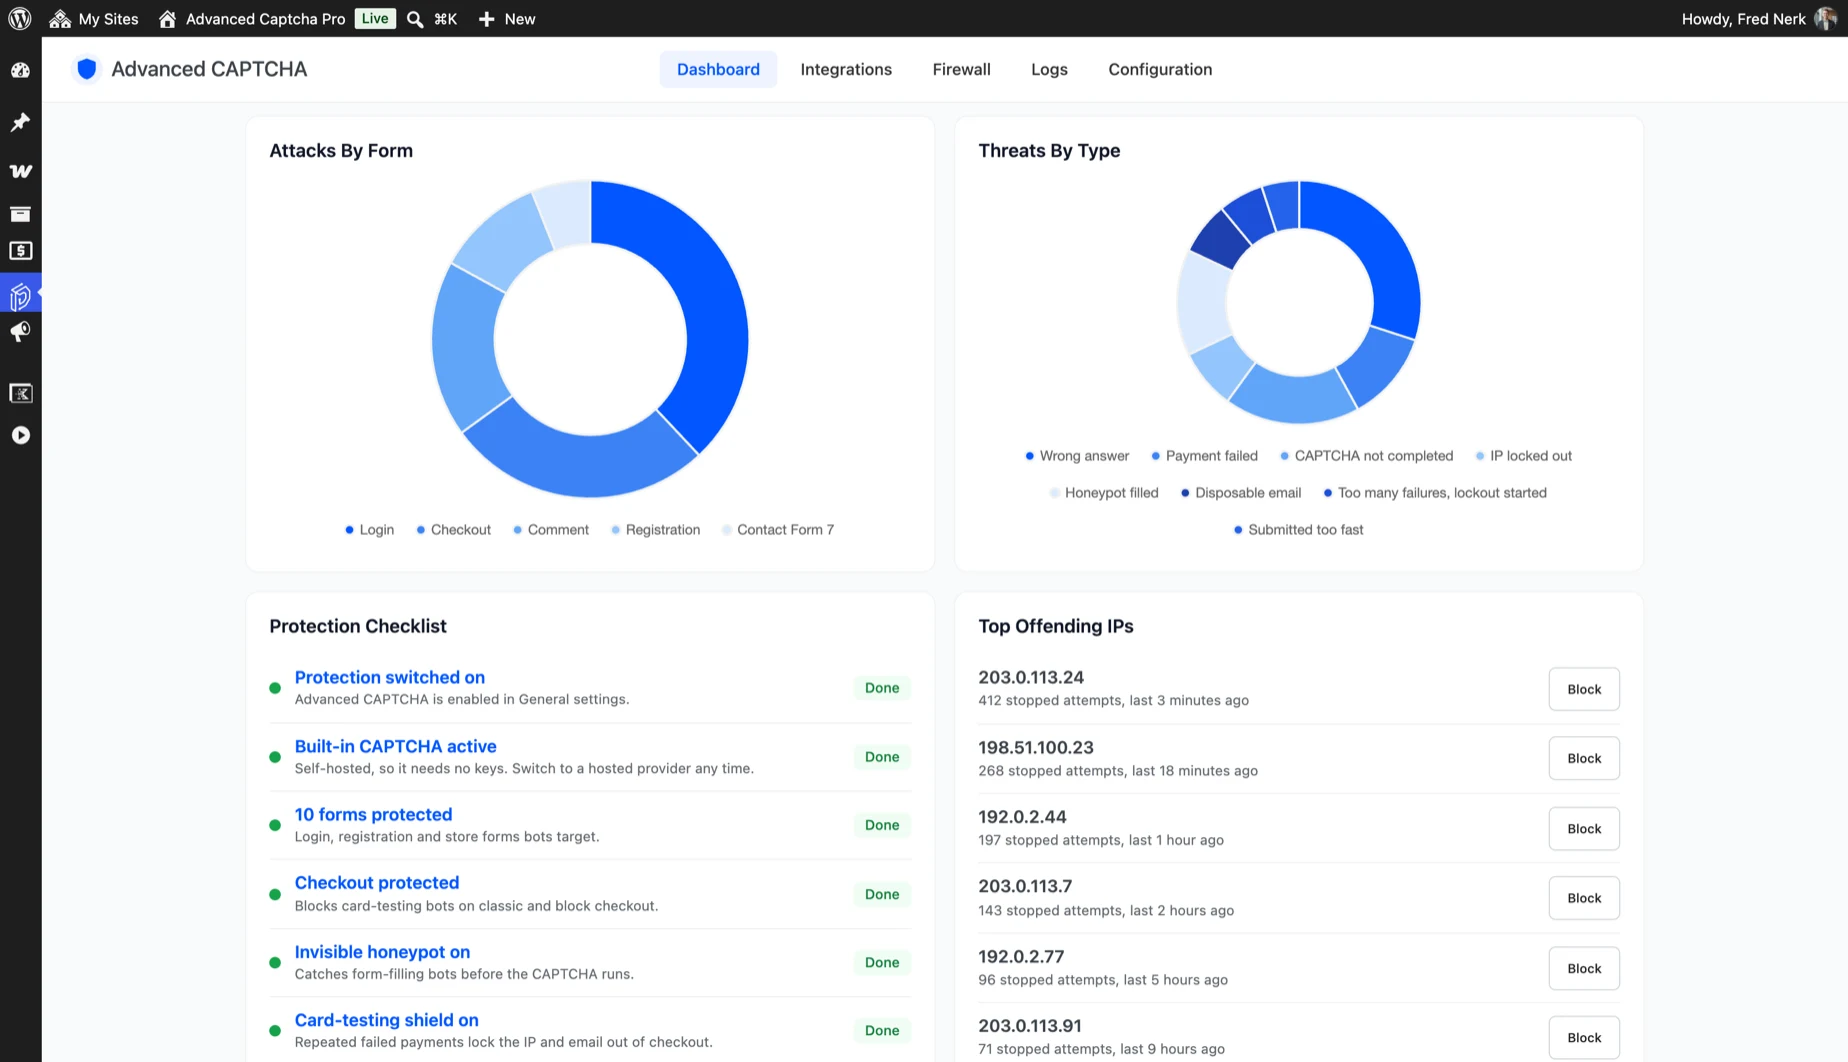
Attacks by form, threats by type and the top offending IPs sit below it. A protection checklist points at any form still left open.
- Bots stopped and humans passed
- Attacks by form and threat type
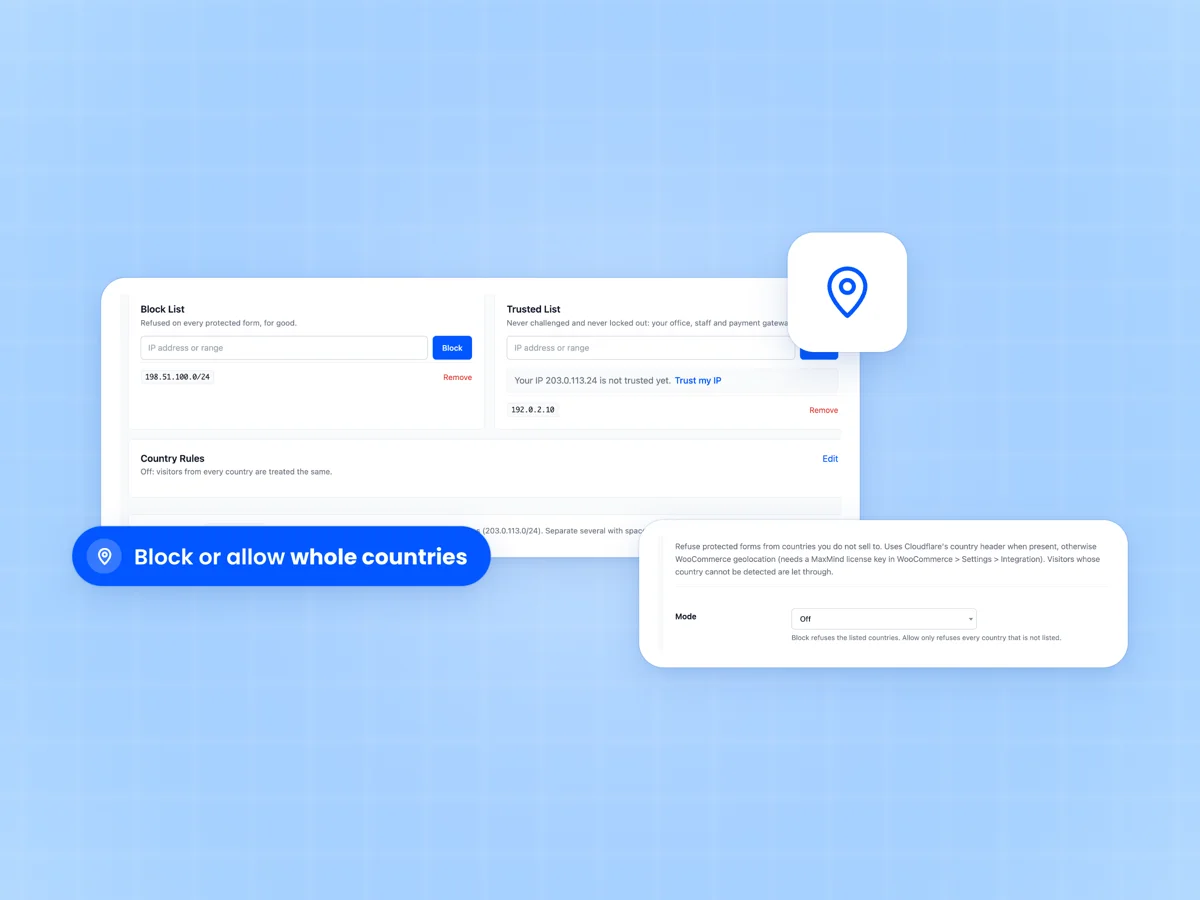
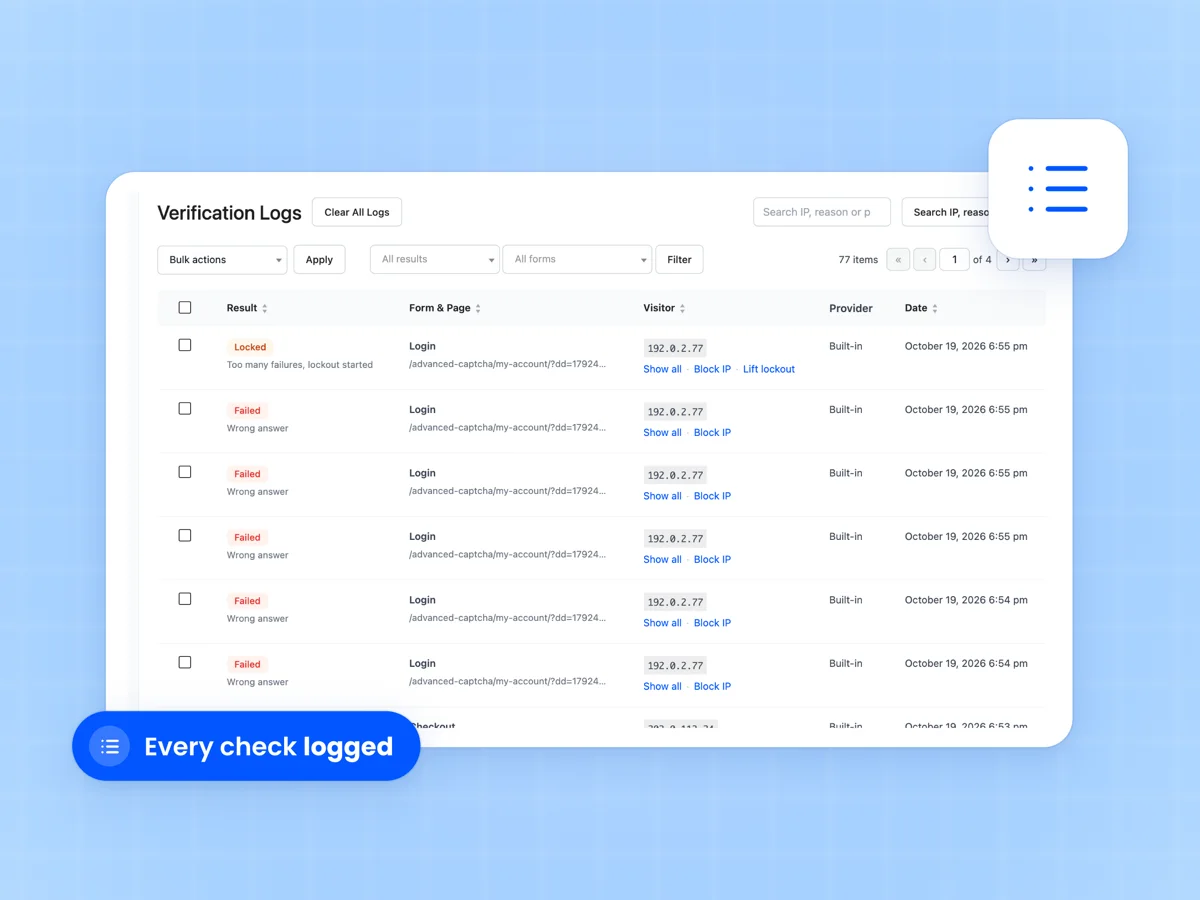
- Top offending IPs with one-click block
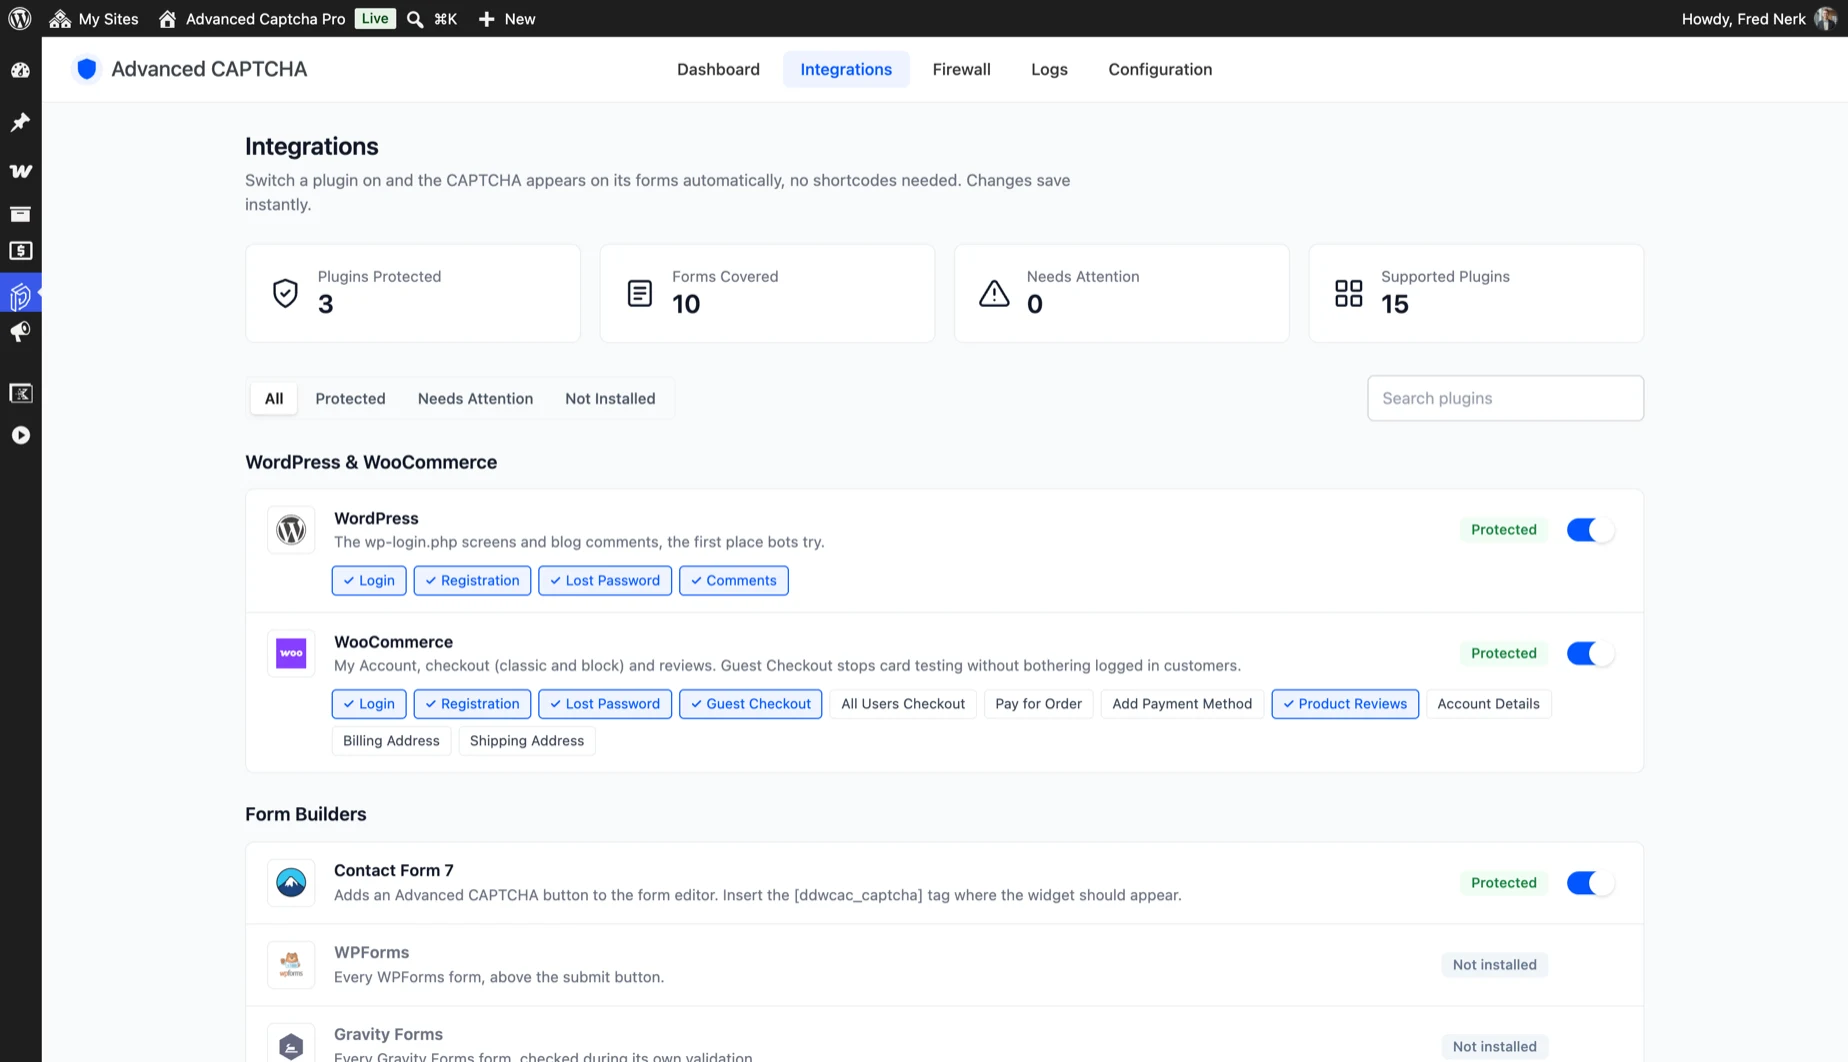
- Protection checklist