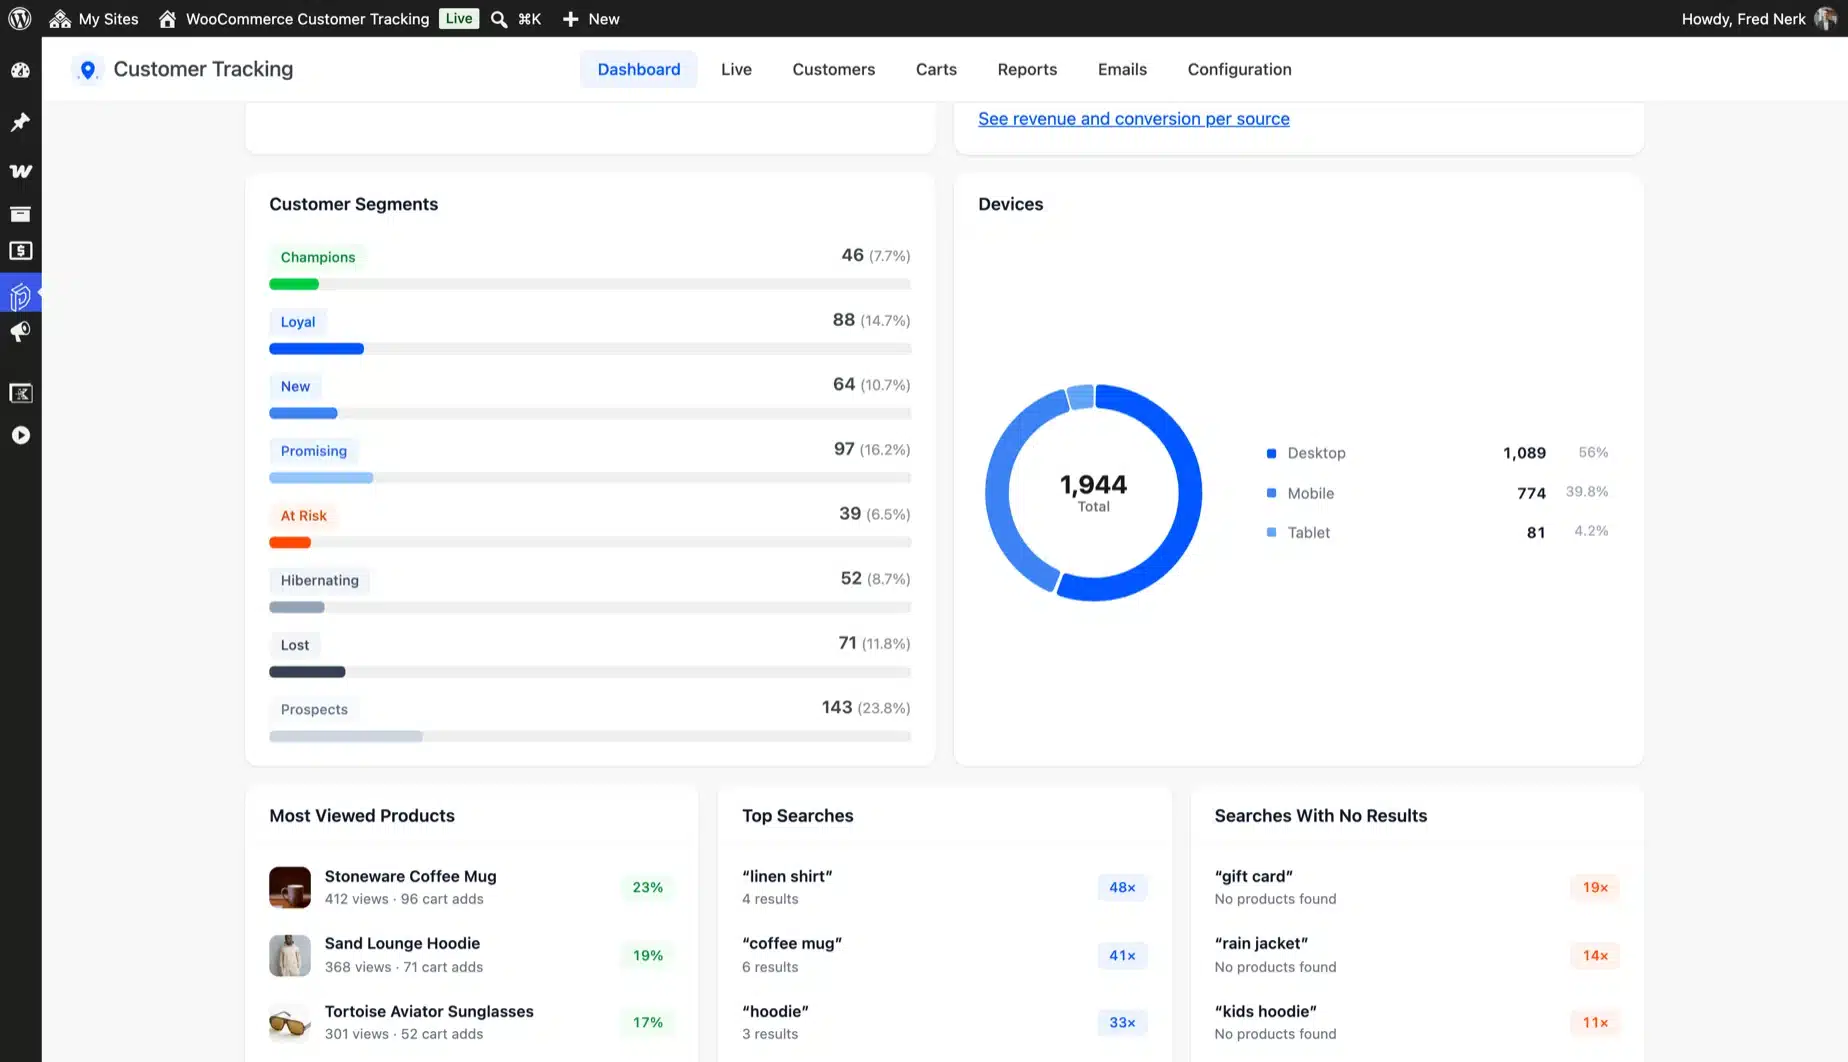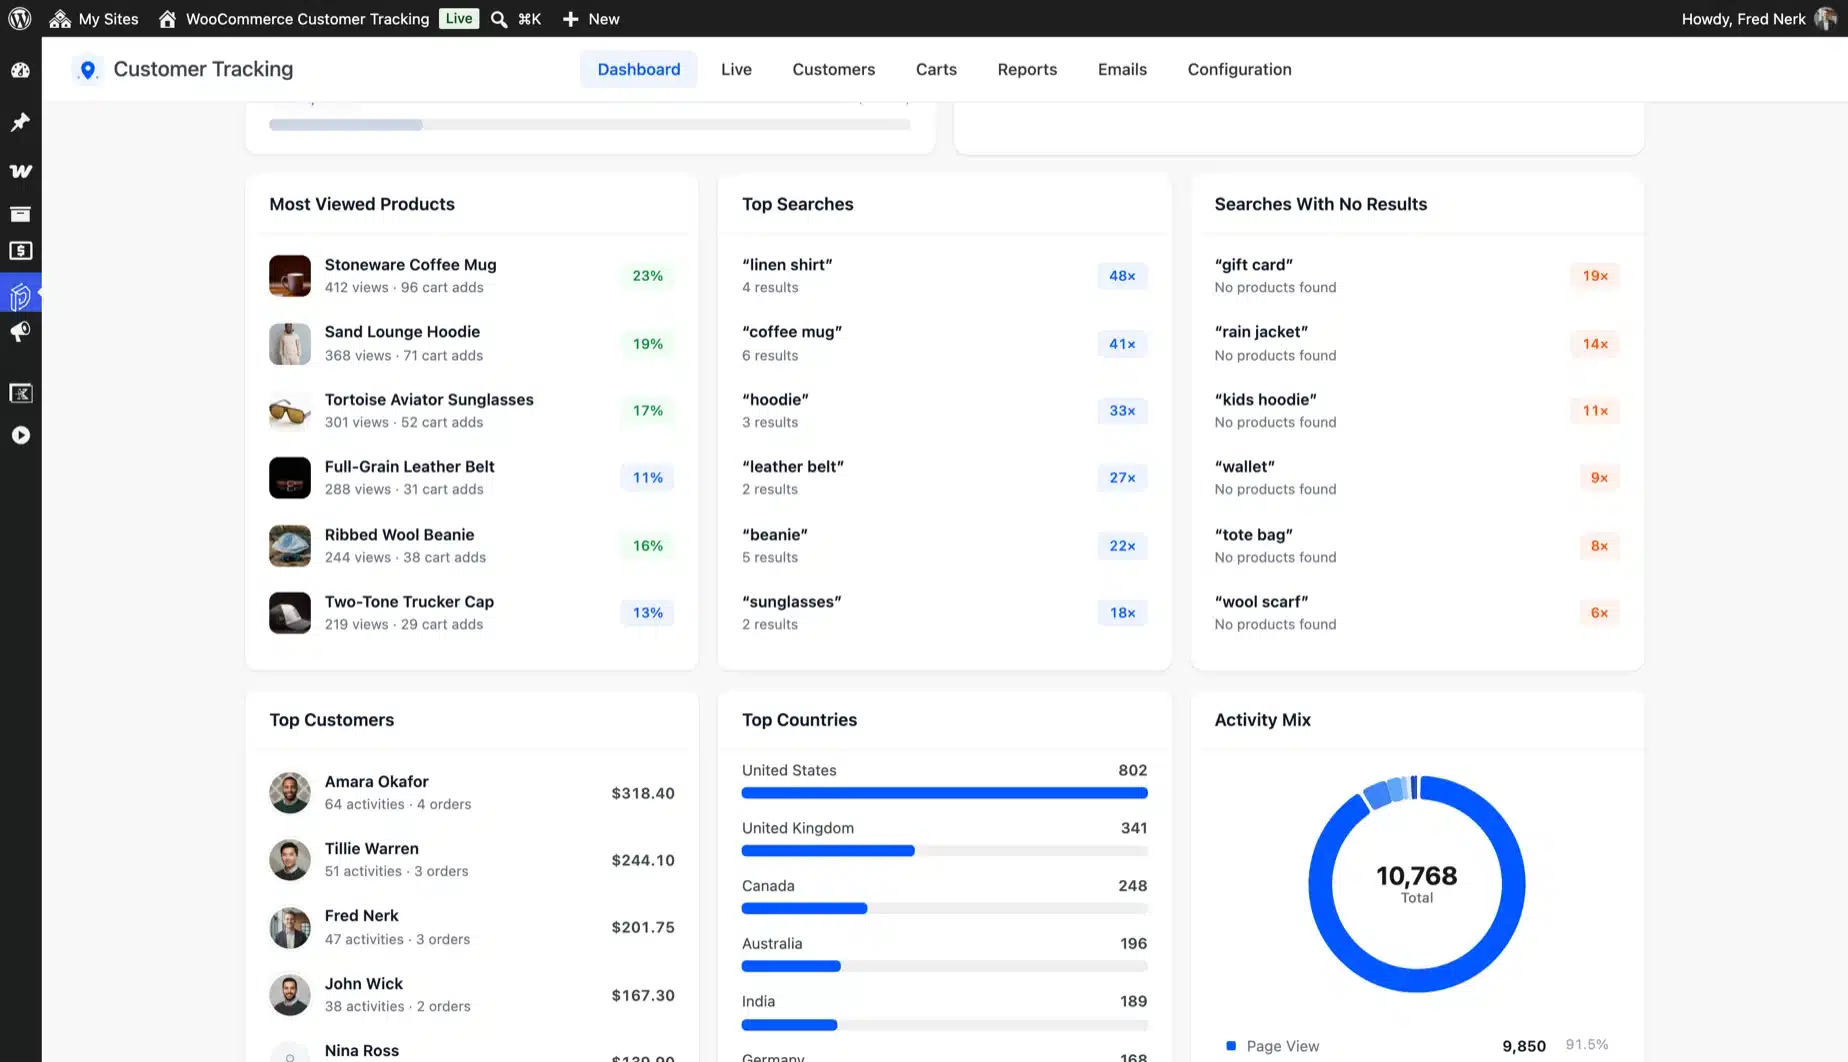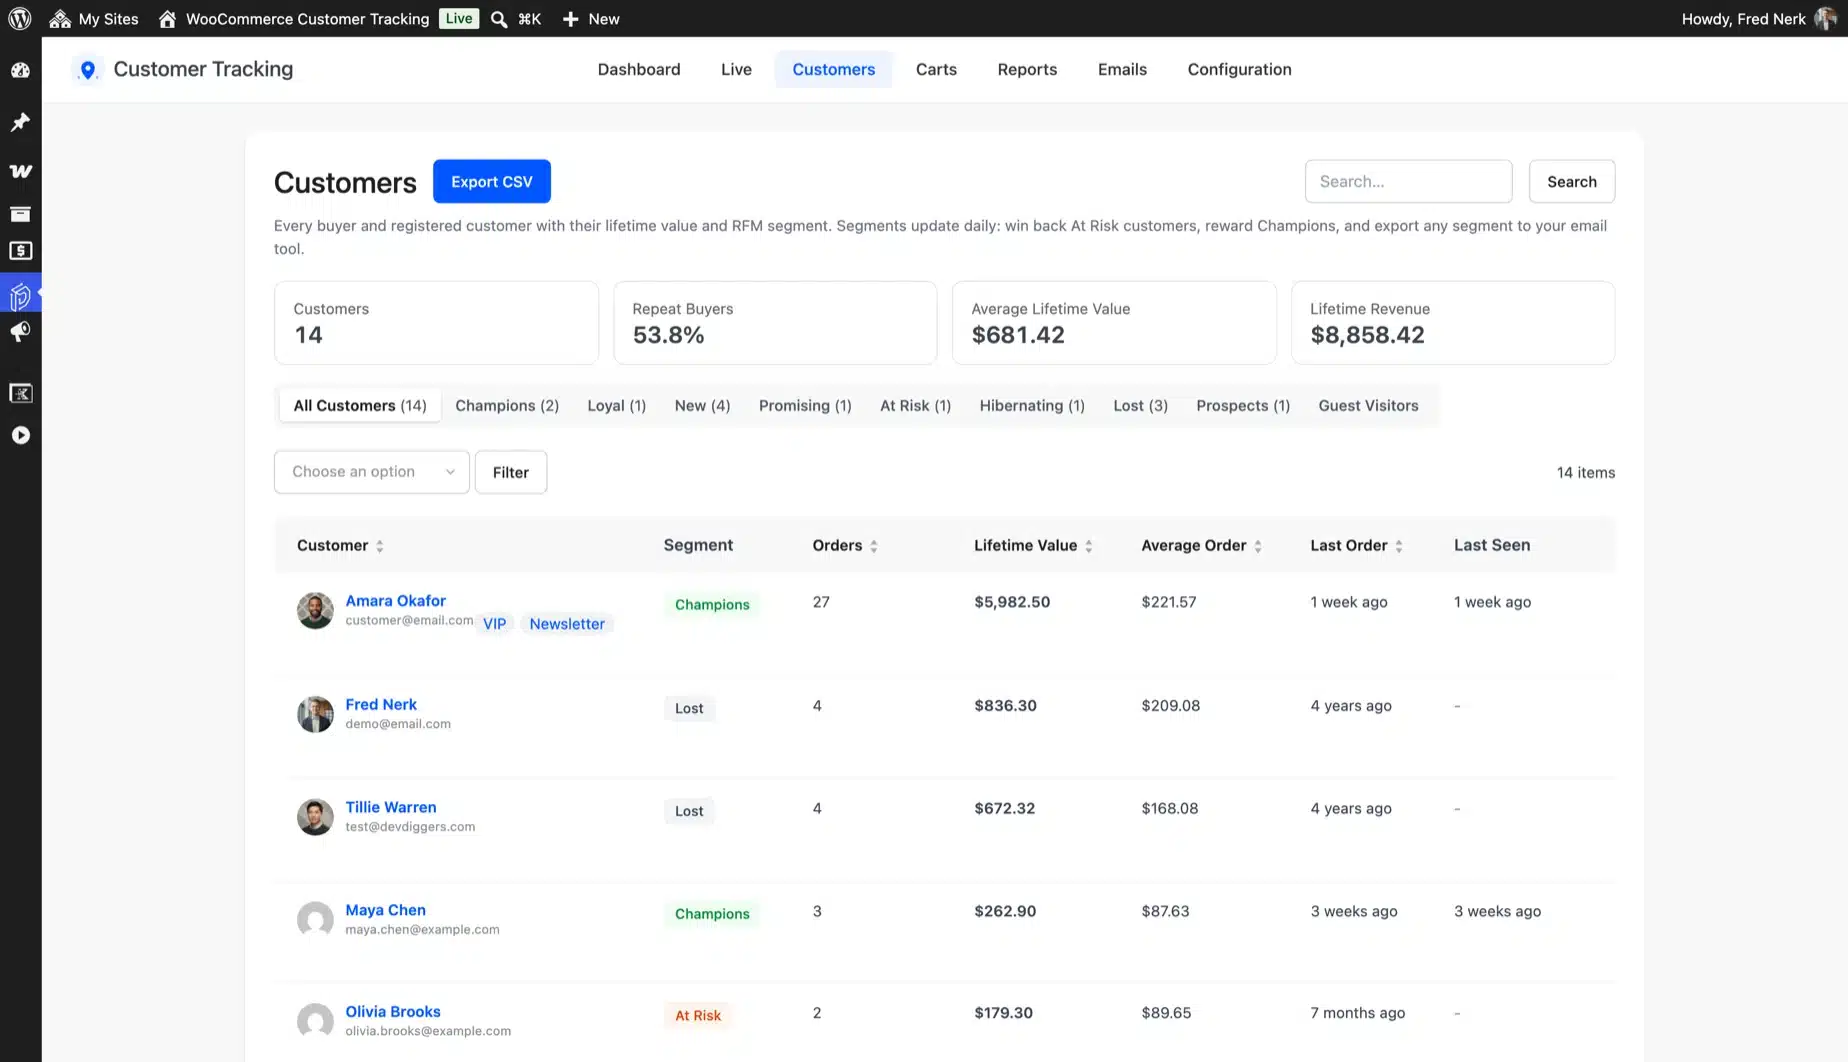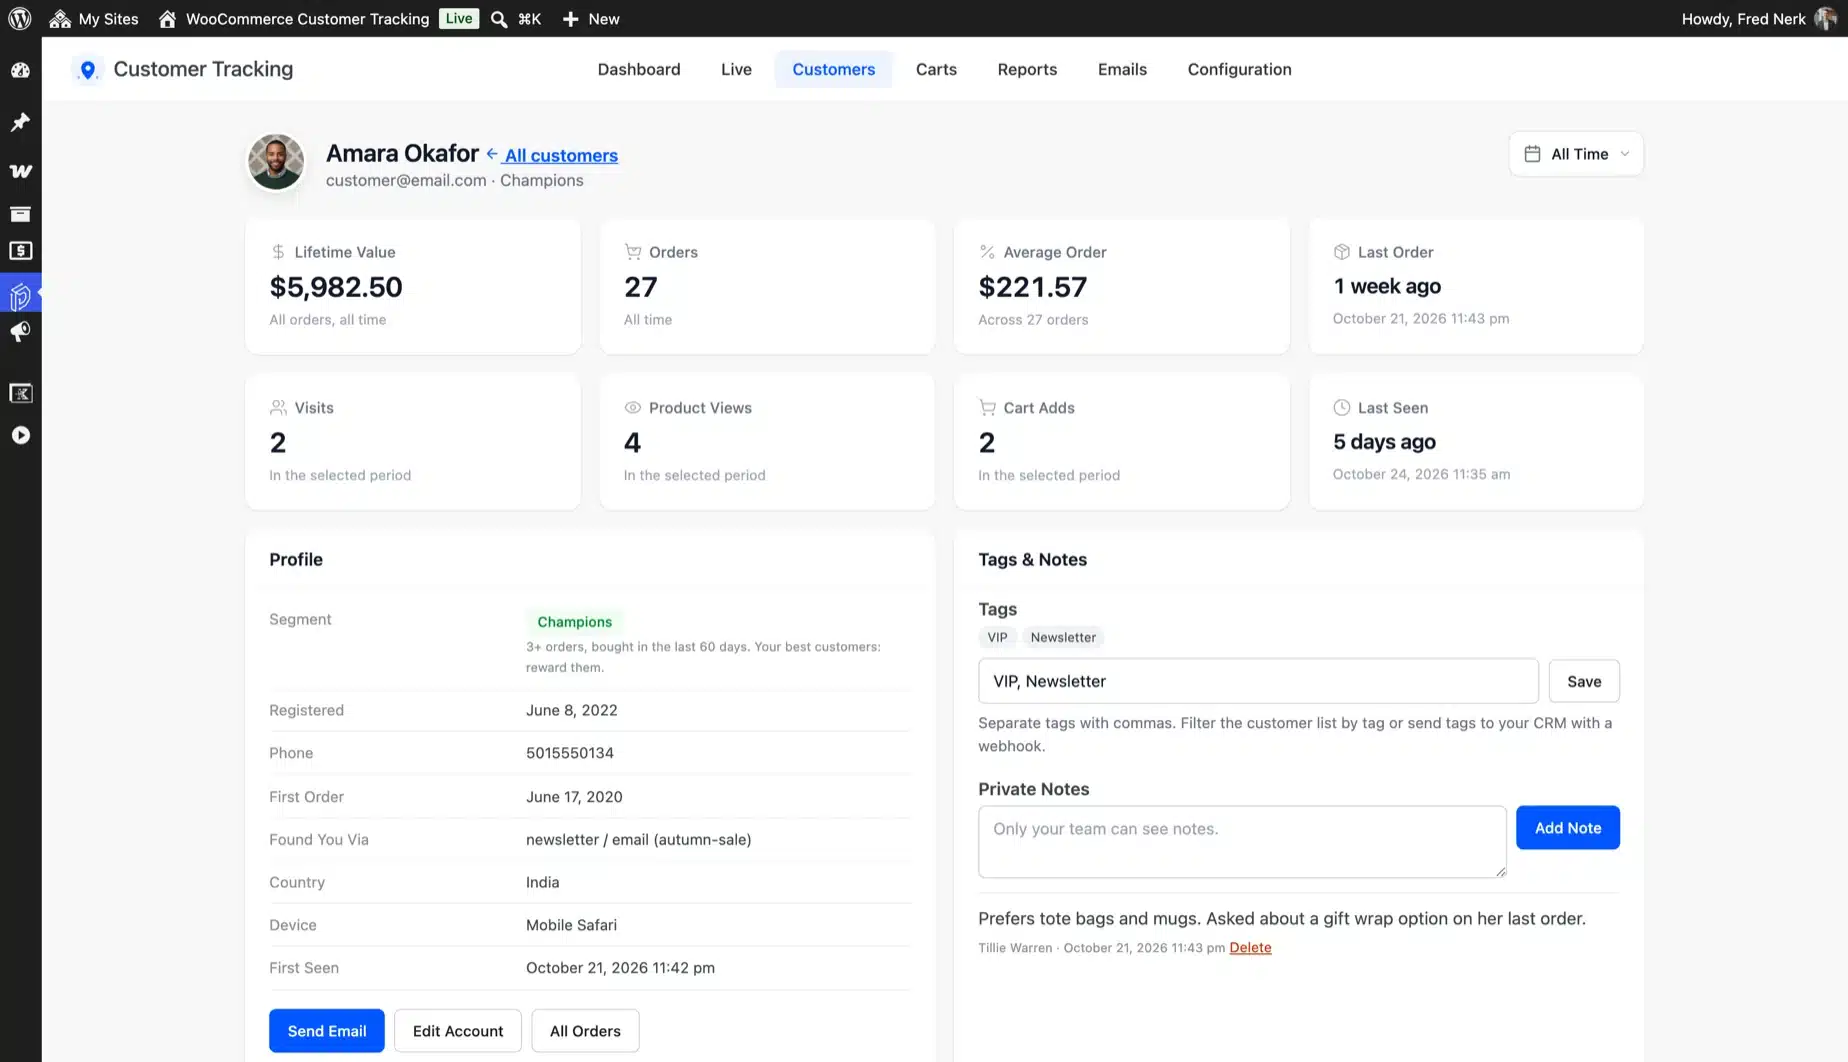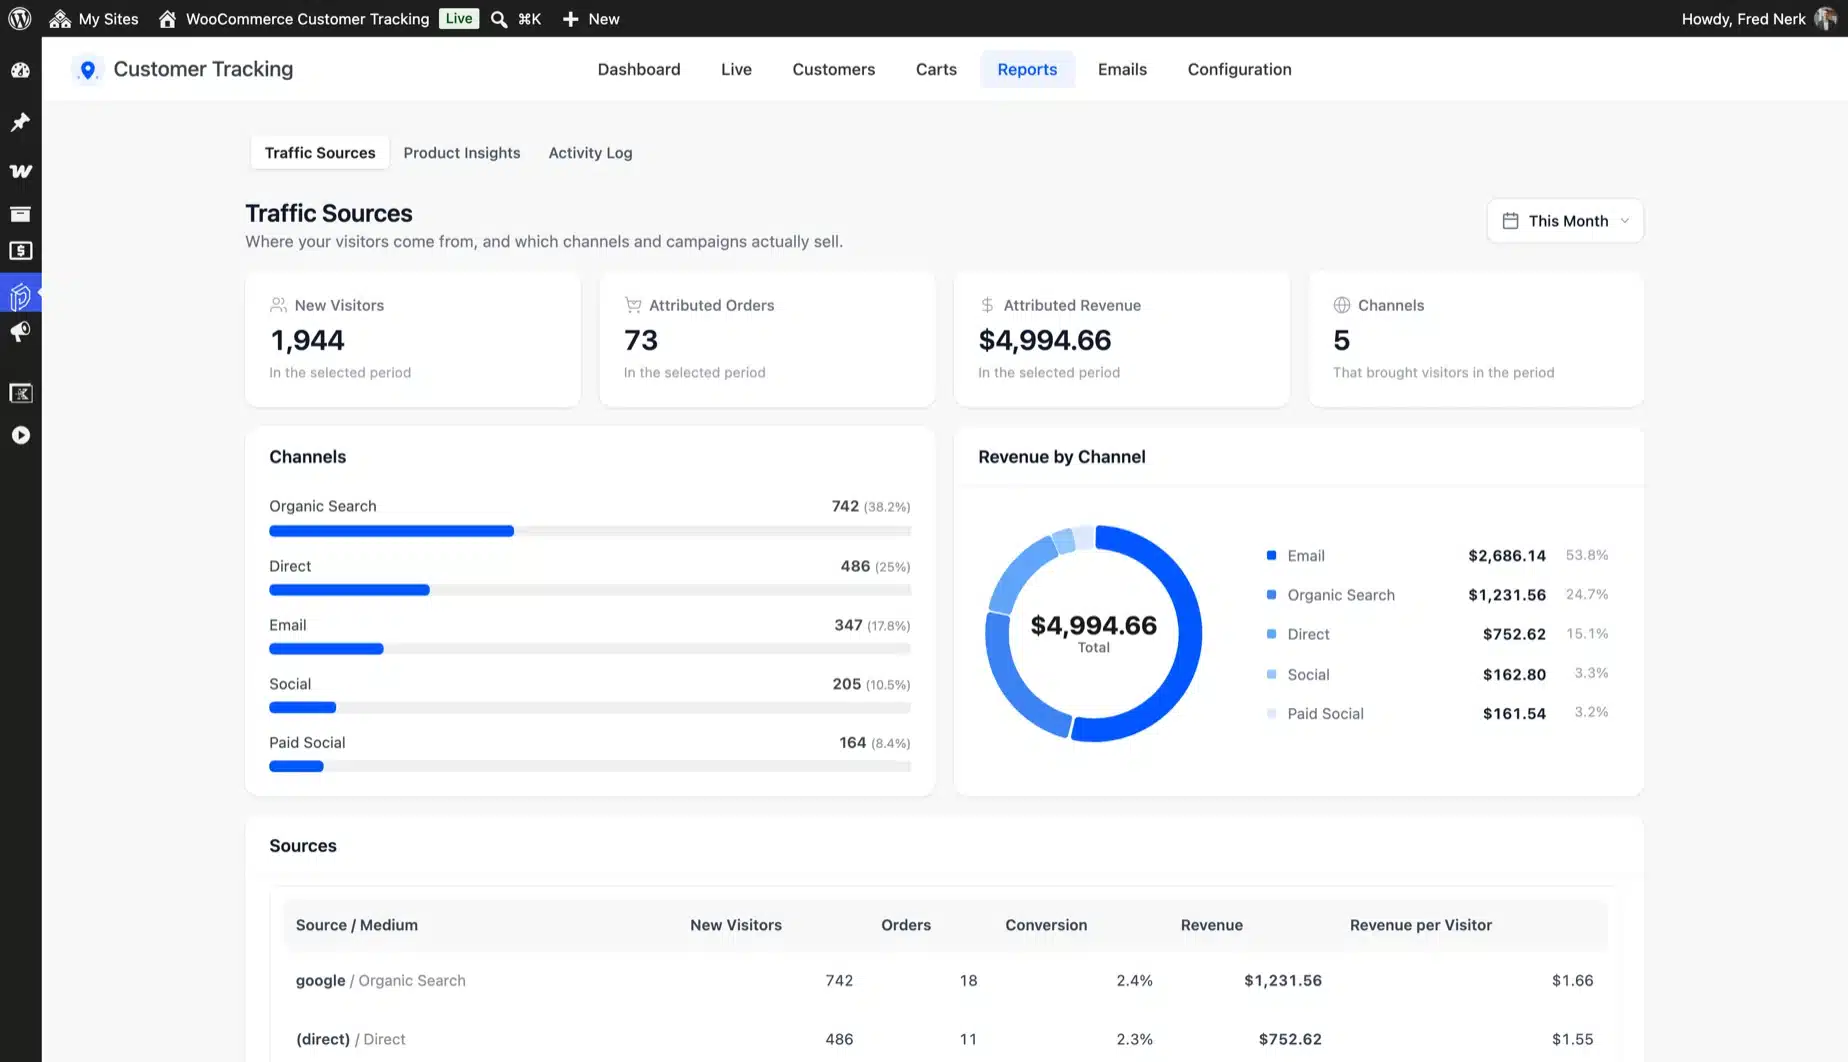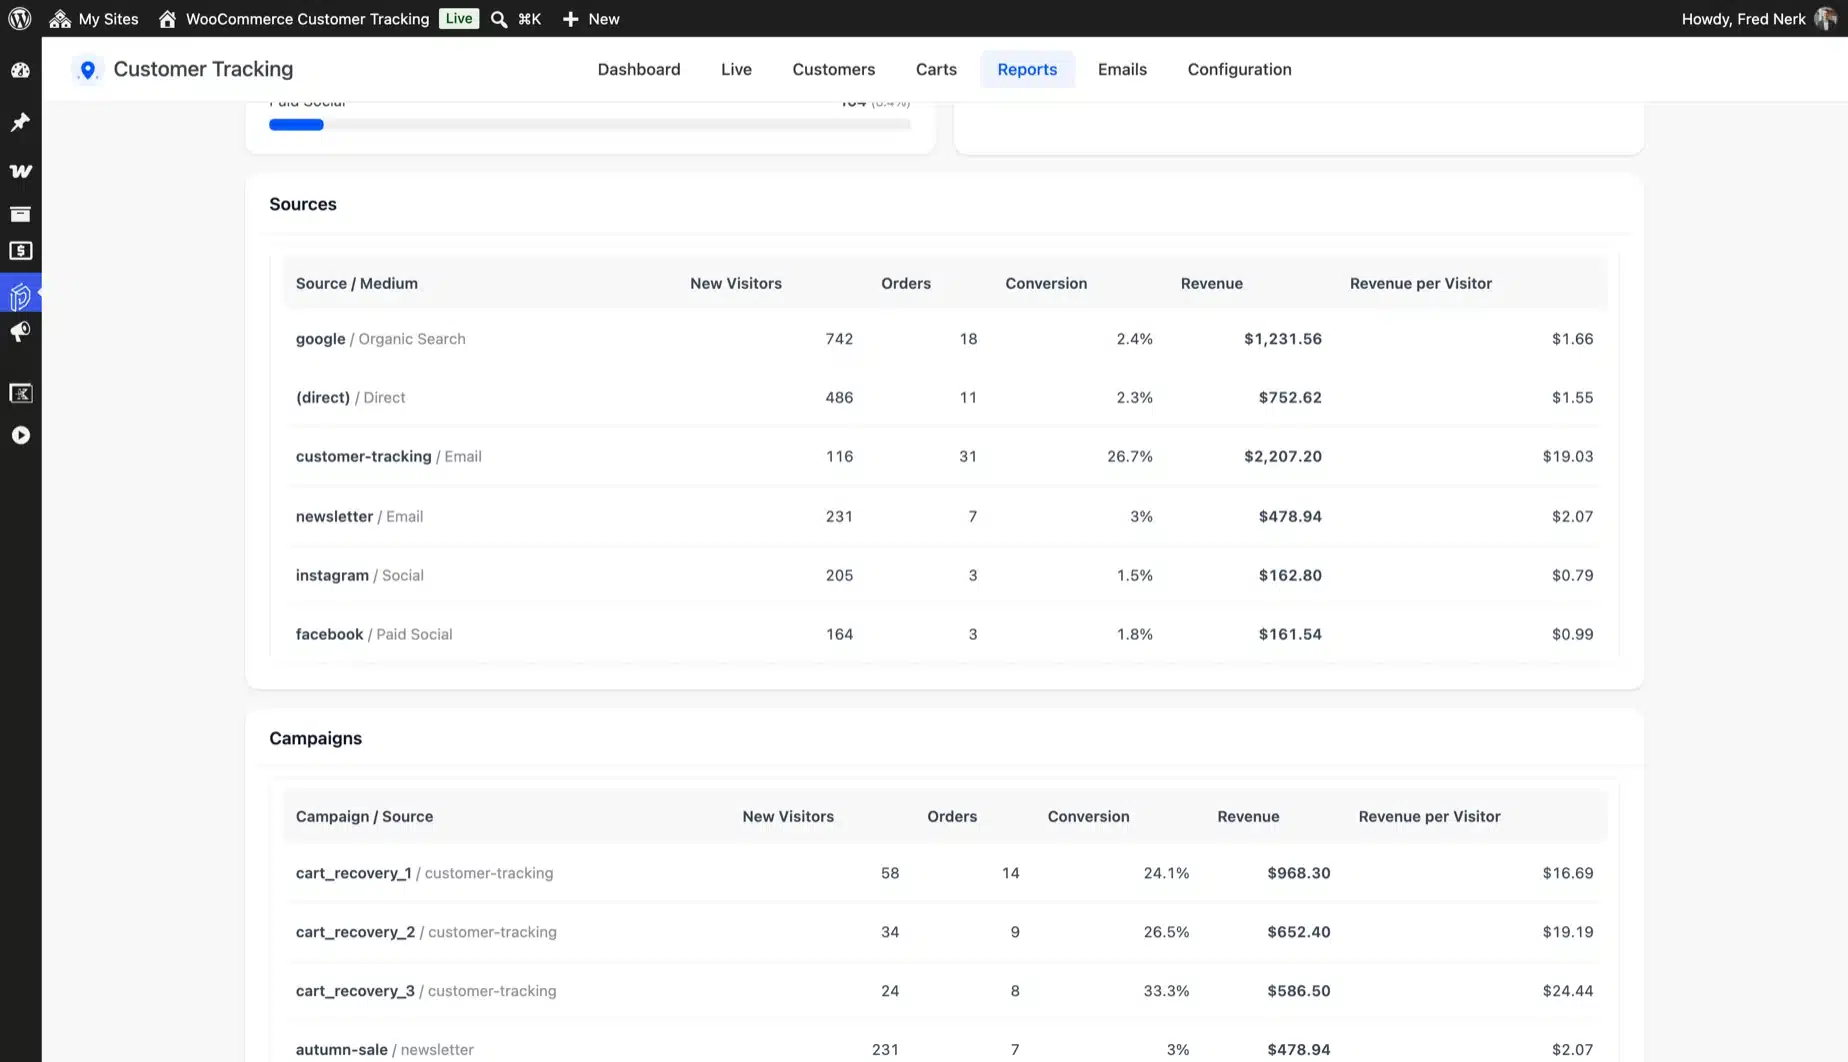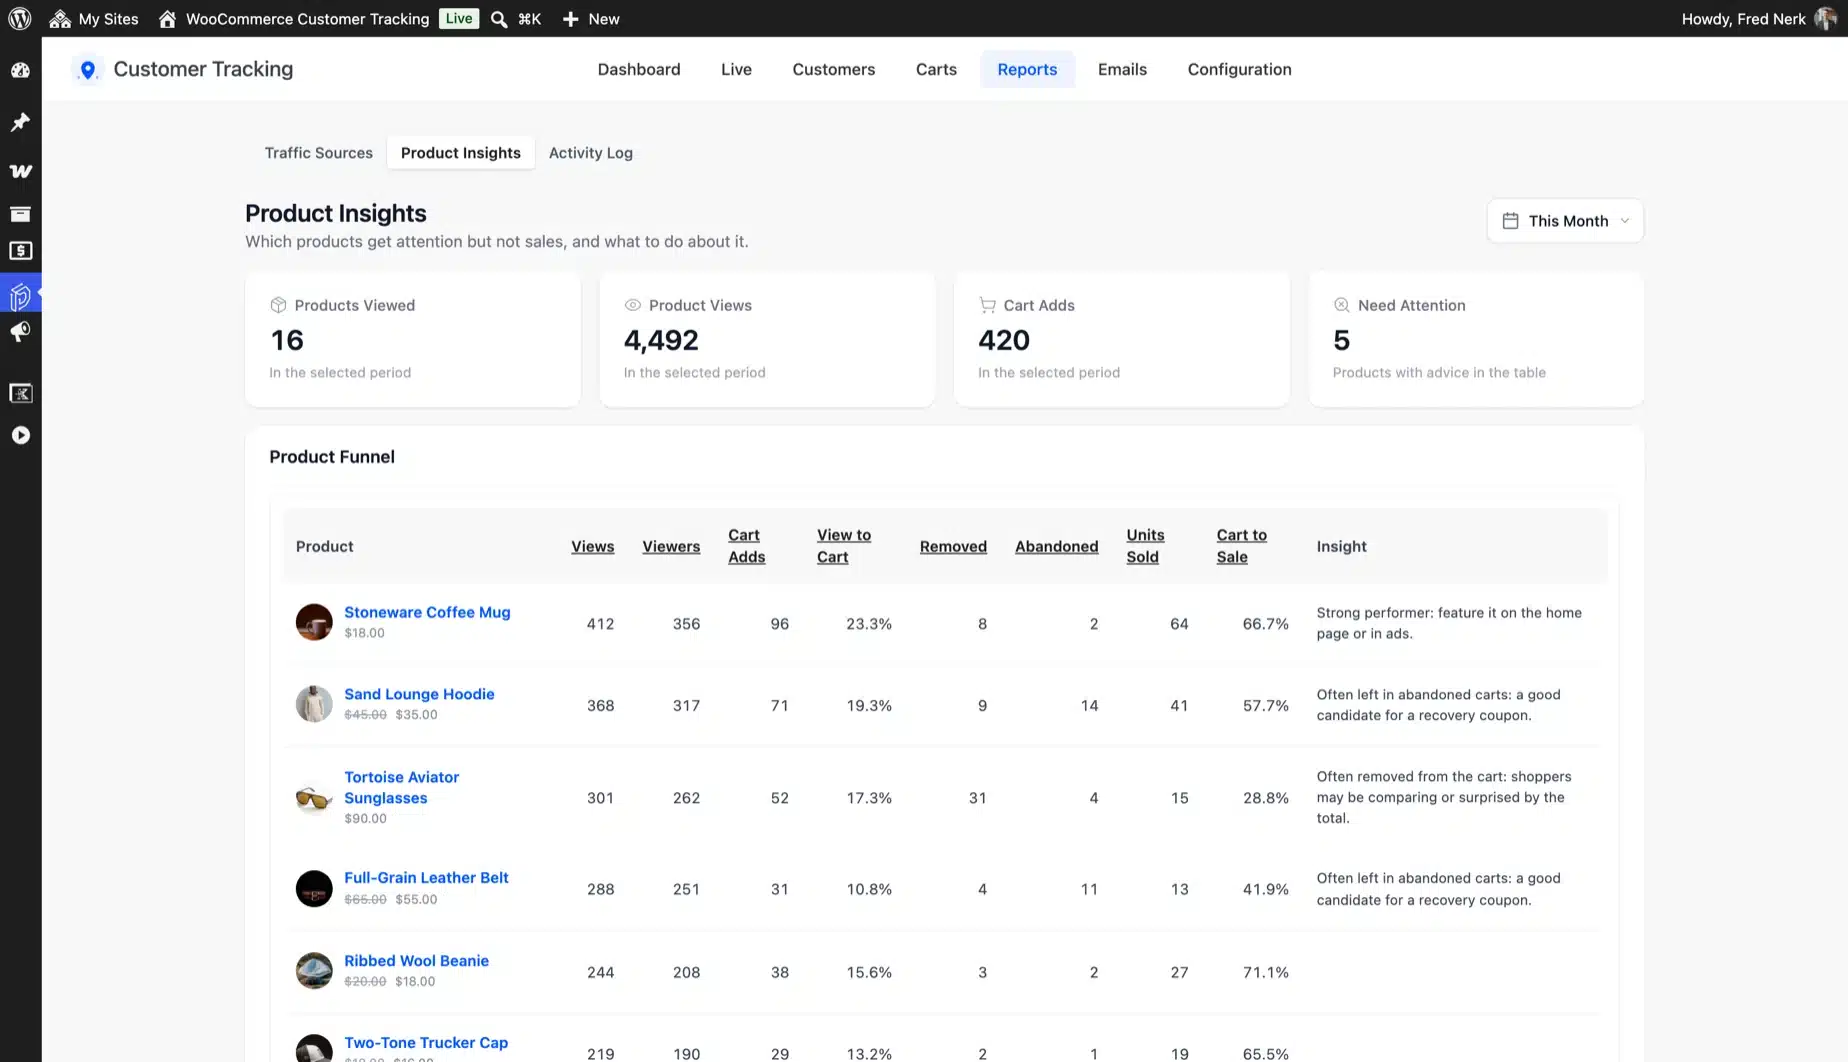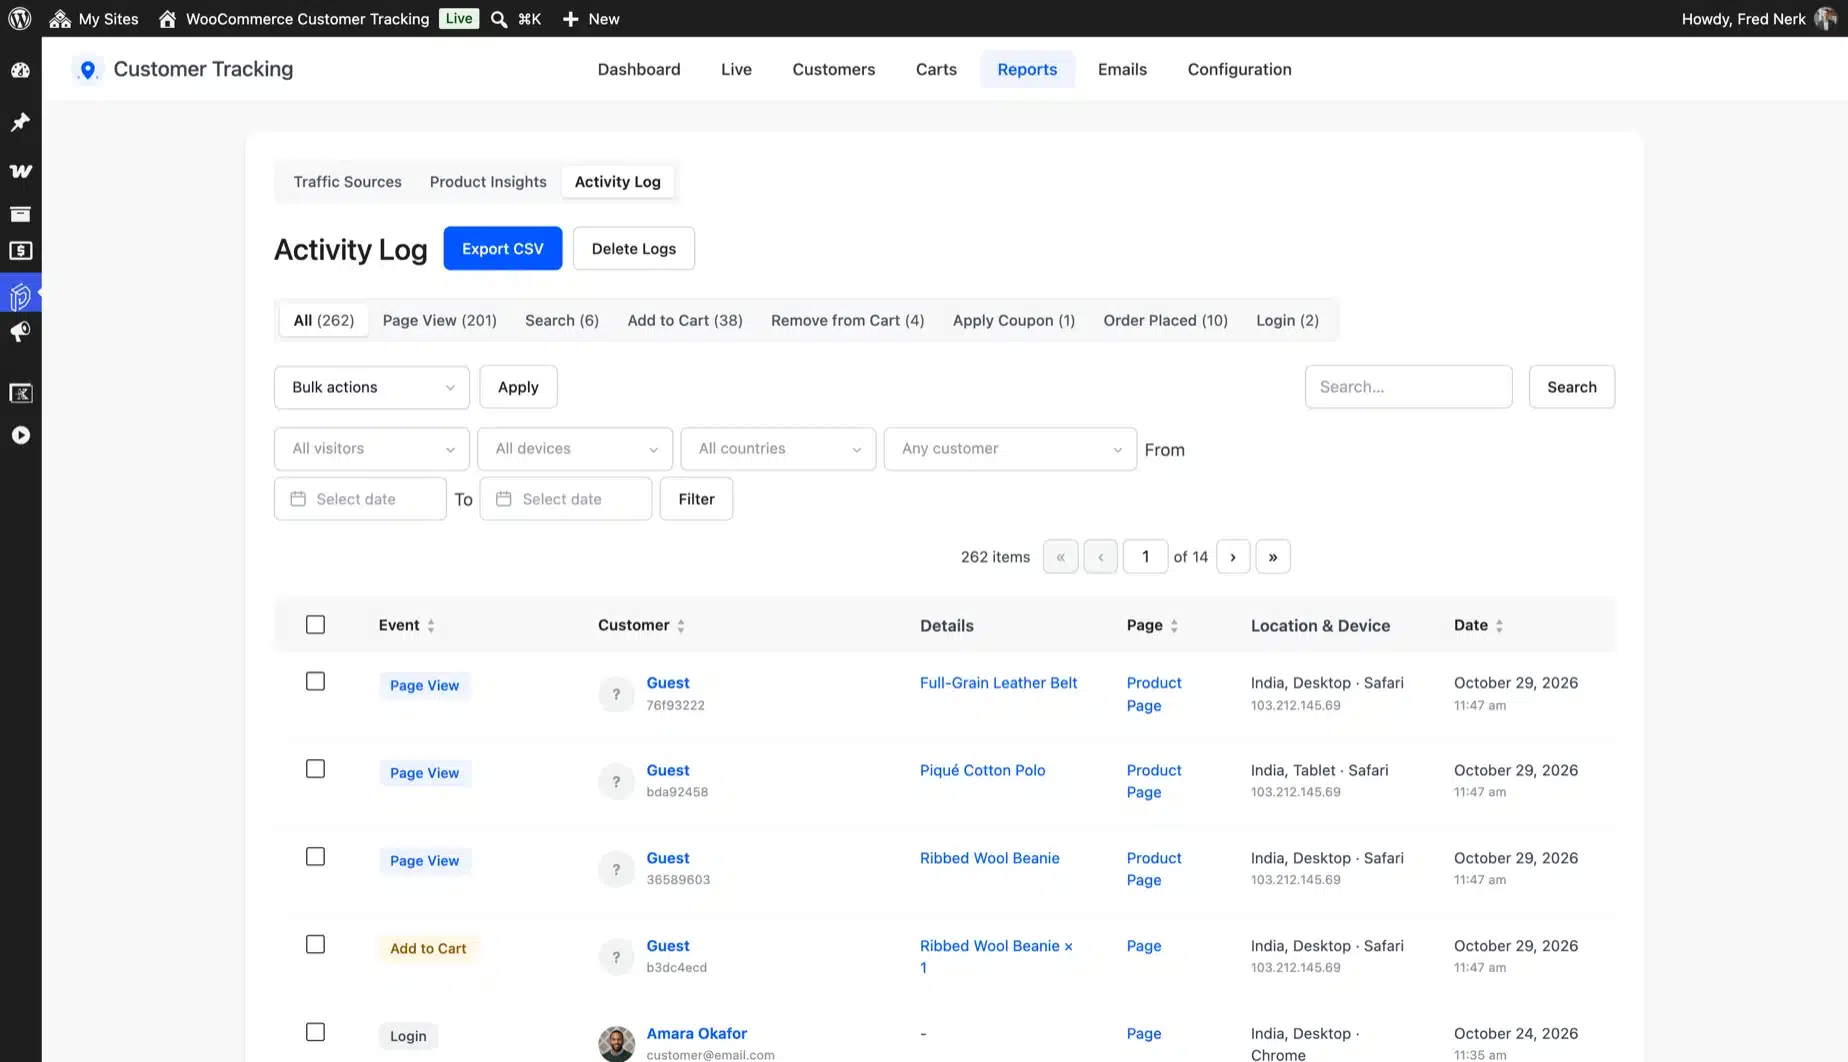










A customer analytics dashboard for your store
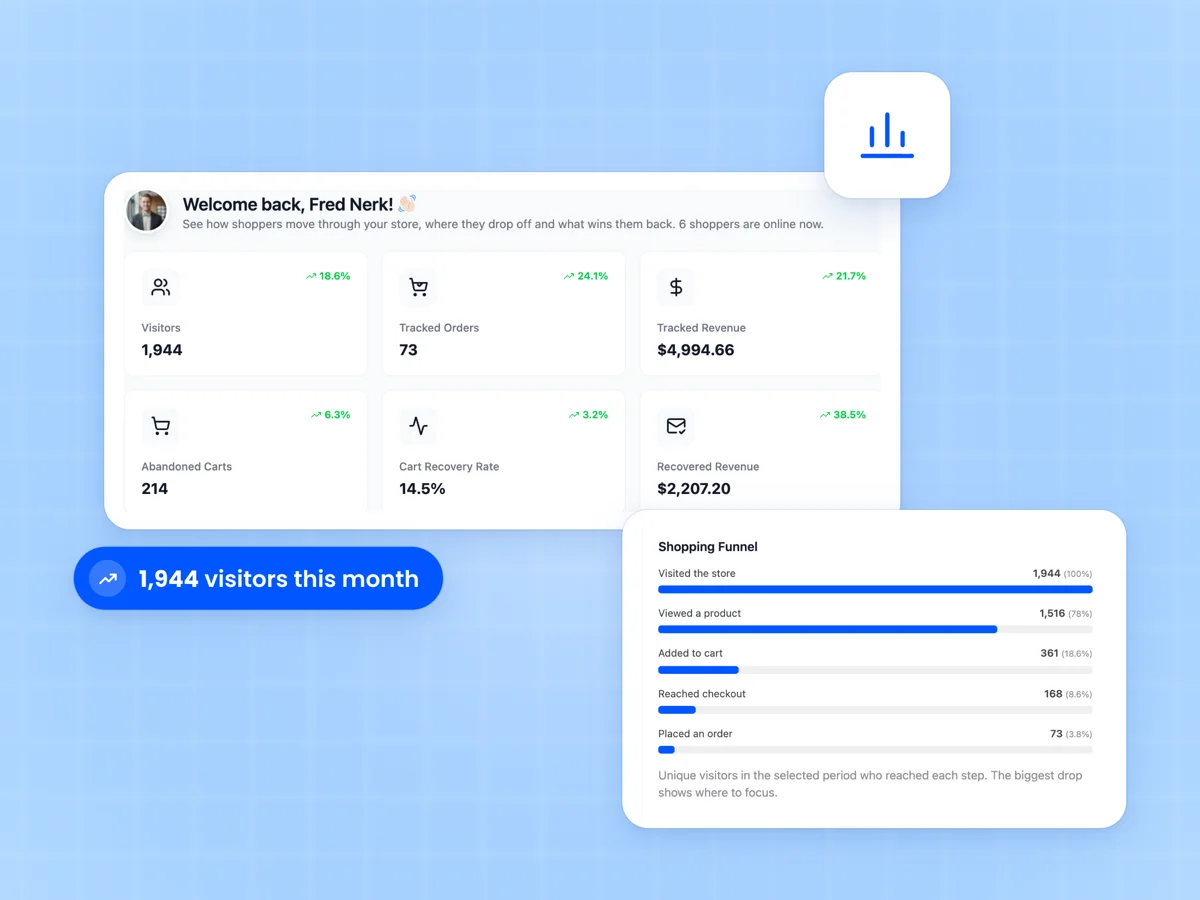
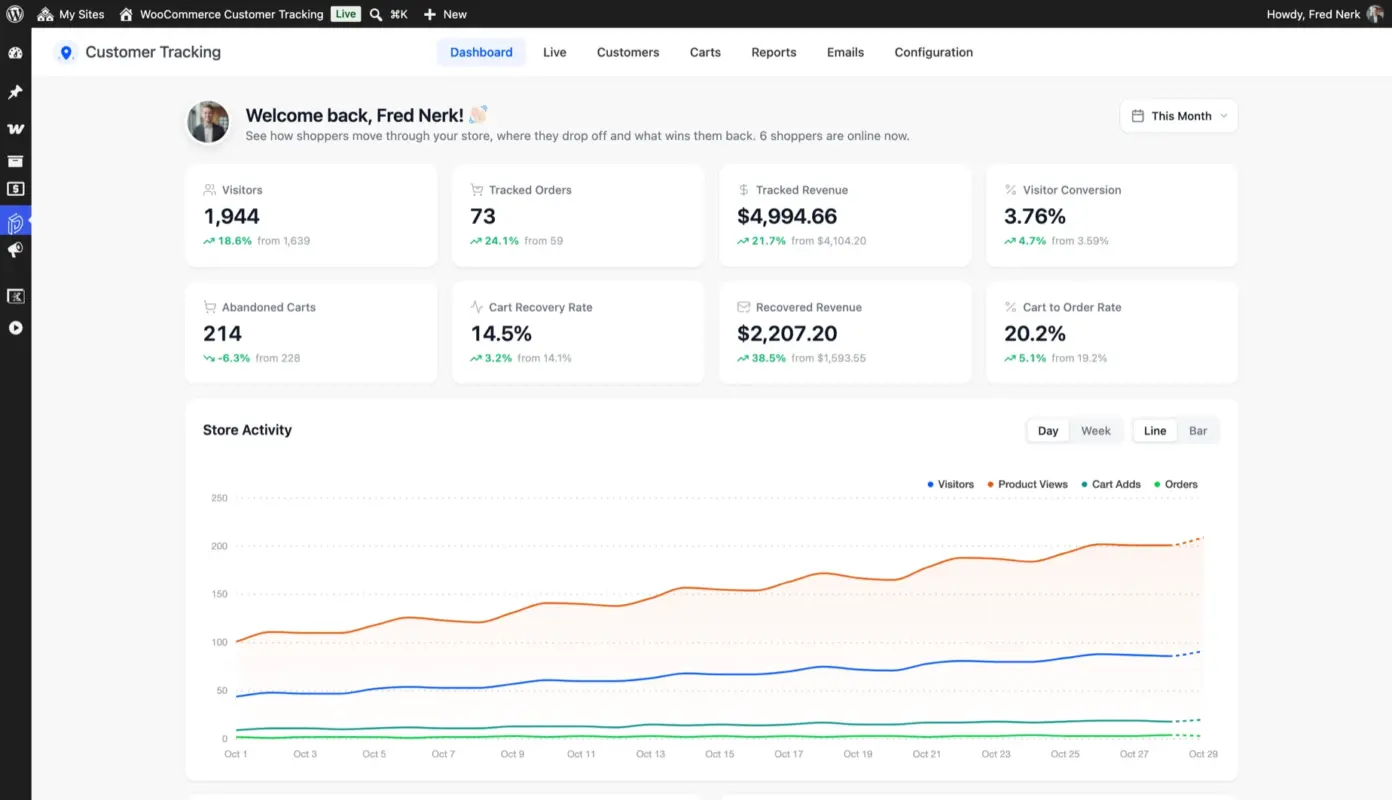
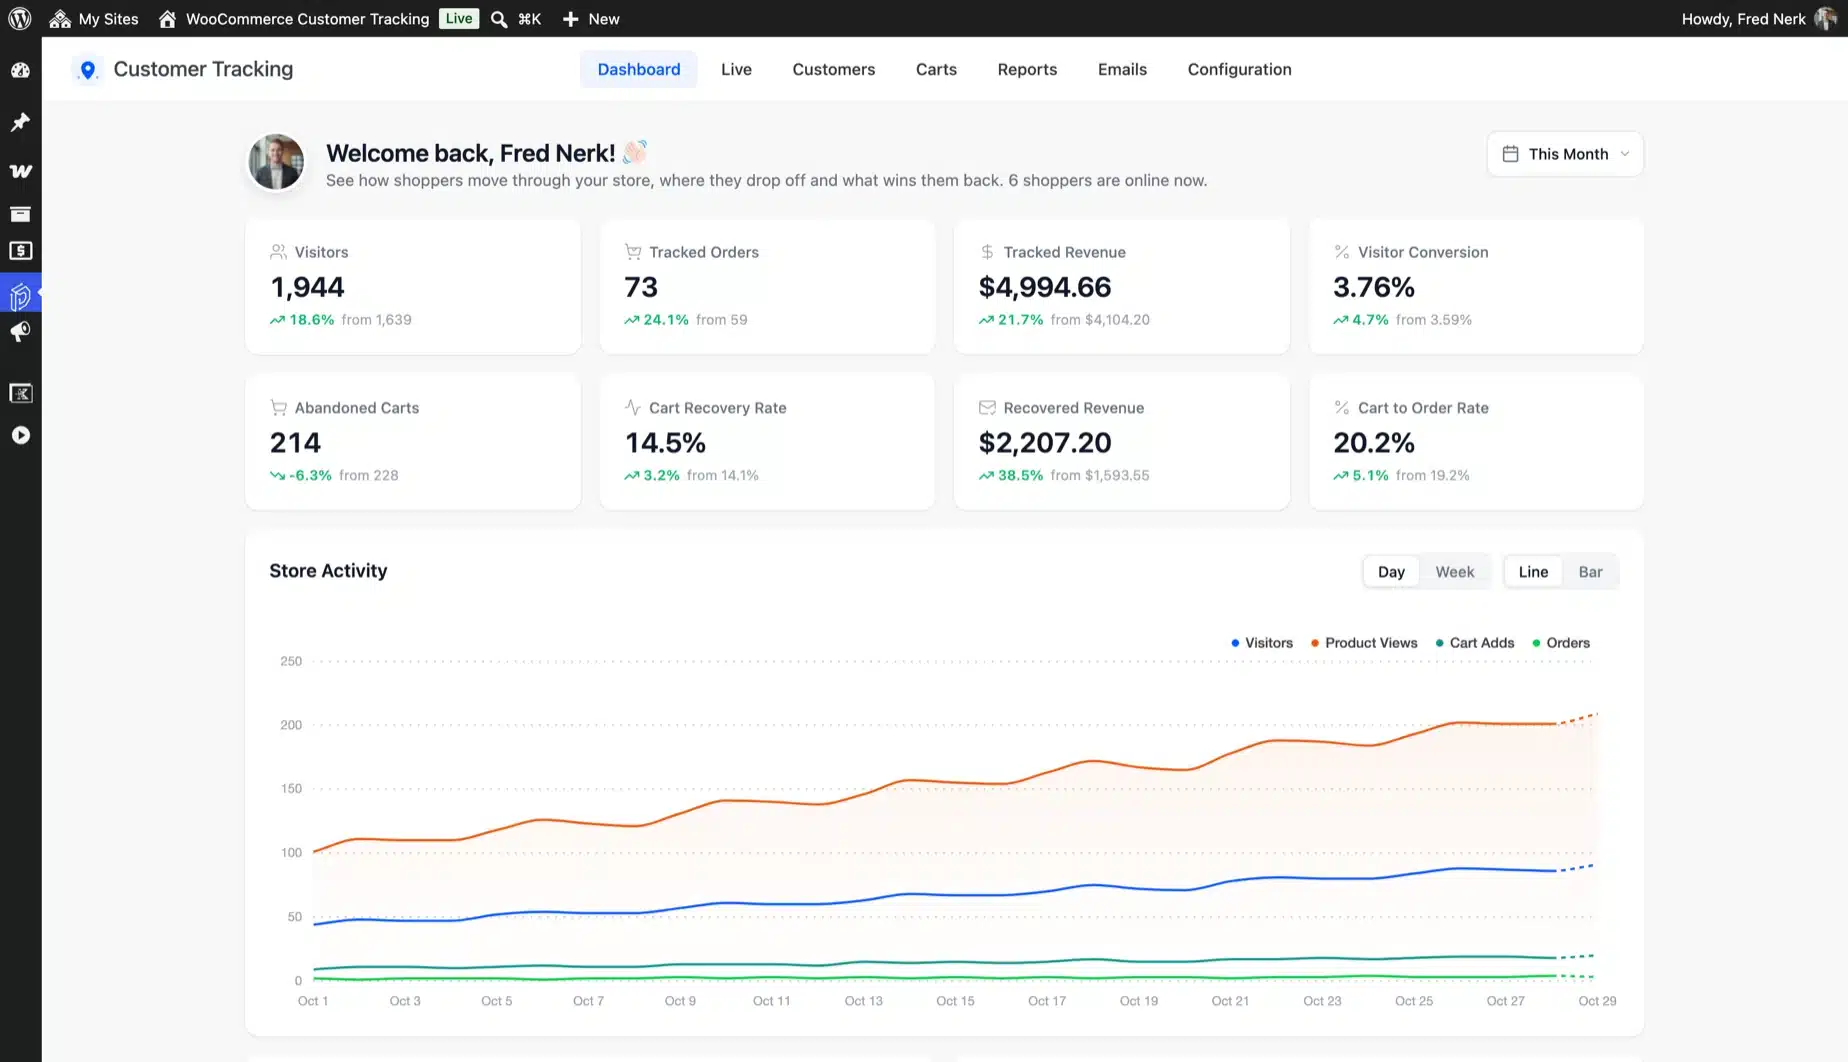
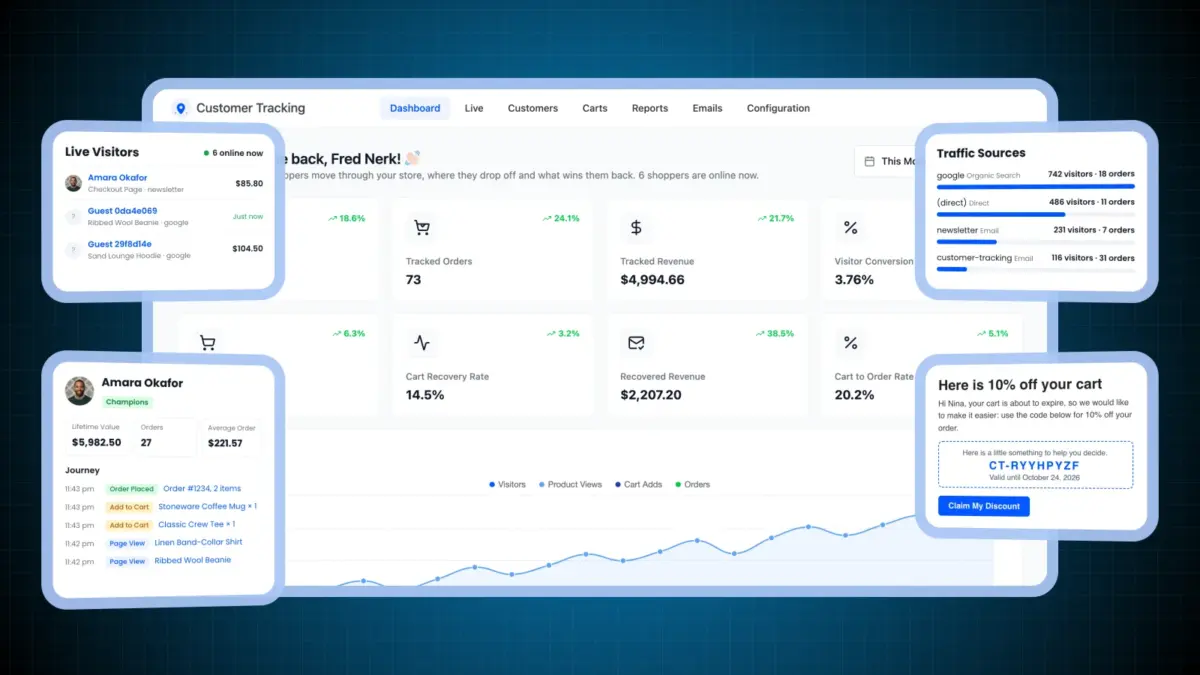
Eight cards show visitors, tracked orders and revenue, visitor conversion, abandoned carts, recovery rate, recovered revenue and cart to order rate. Each one compares with the period before.
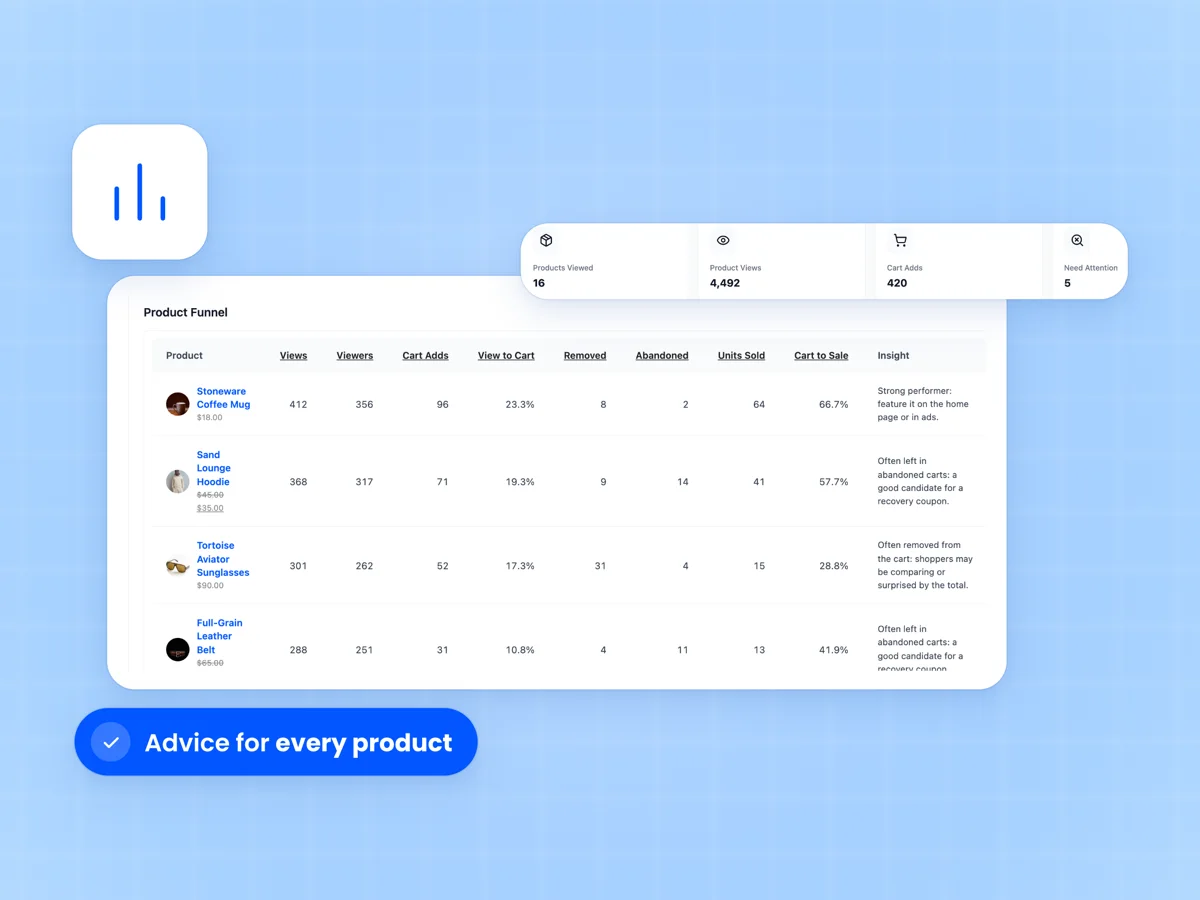
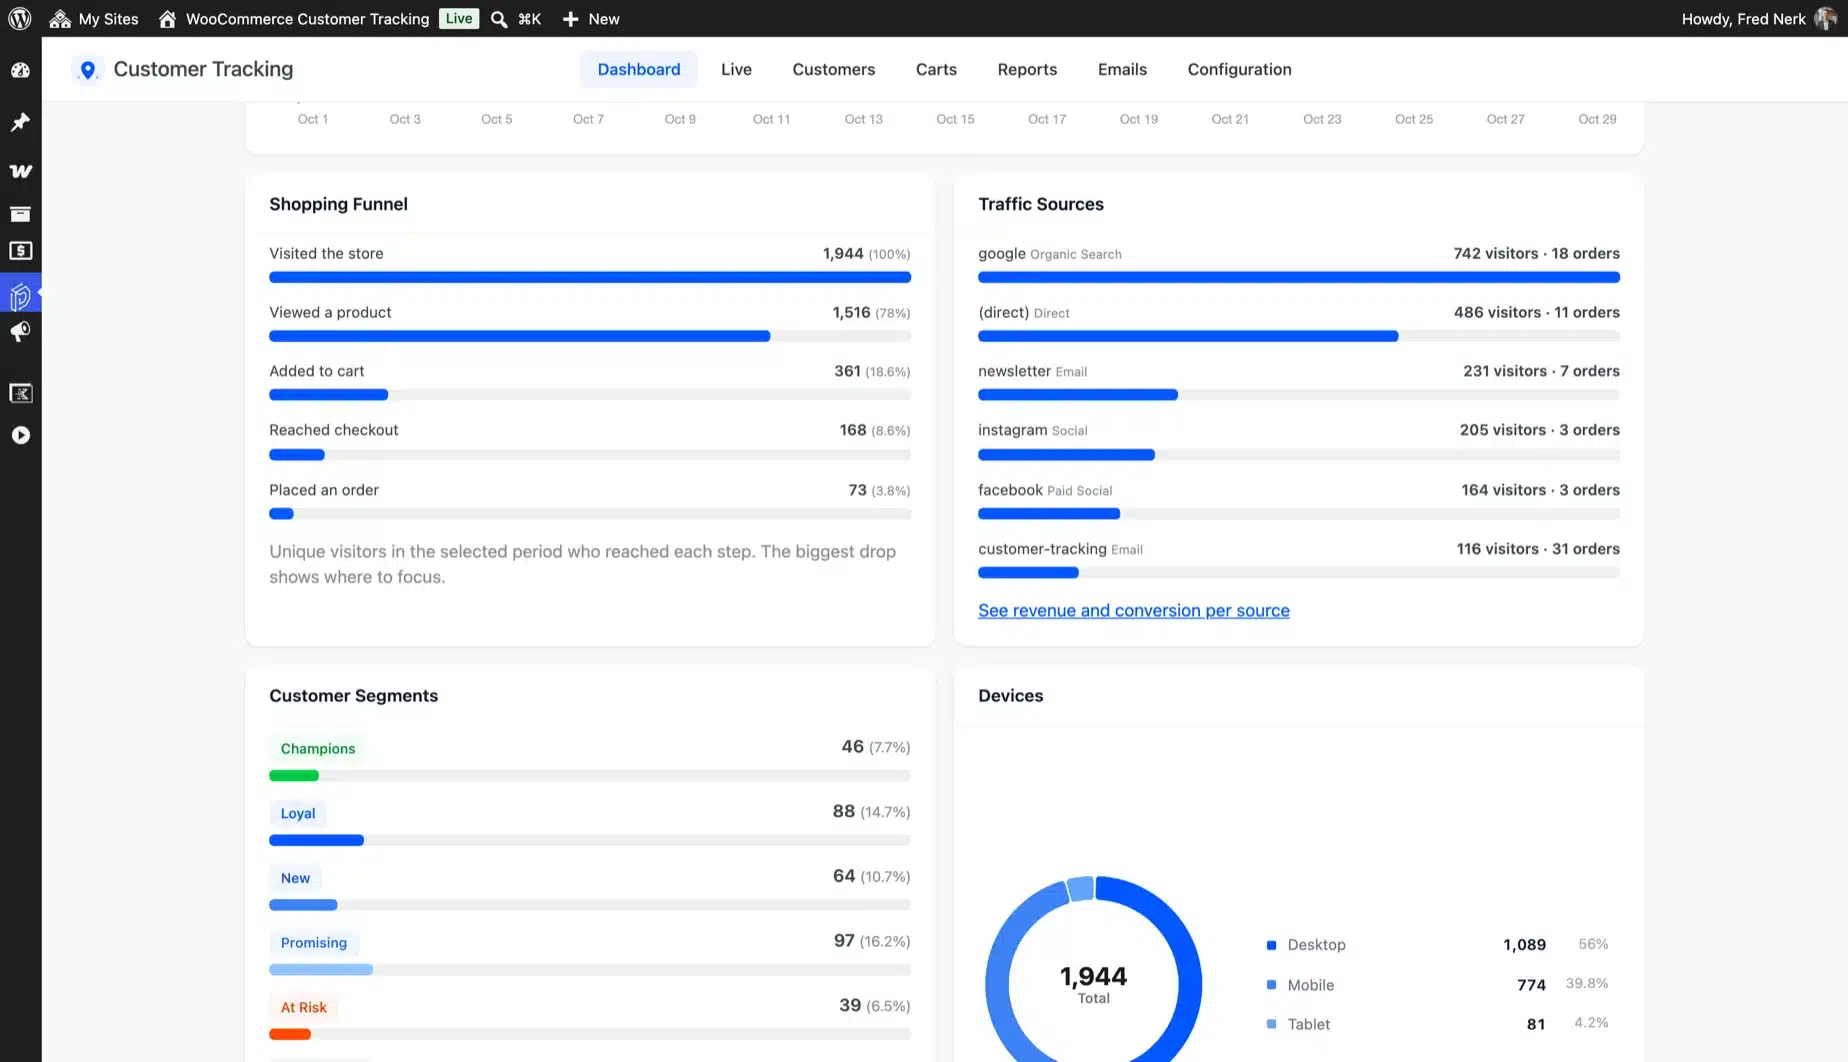
The Store Activity chart plots visitors, product views, cart adds and orders per day. The Shopping Funnel shows the step where most shoppers drop off.
- Eight KPI cards with trends
- Store Activity chart and Shopping Funnel
- Date presets and custom ranges