


SEO reporting is the monthly job of turning search data into a short page that says what changed, why, and what happens next. A client reads the first three lines and decides whether the work is paying off.
In October 2026 we rebuilt our report outline from Google’s Search Console help, its GA4 help and the Data Studio docs. DevDiggers reports on its own site from Search Console data, and the template below follows Google’s own metric definitions. We did not connect a client account for this guide, so the screens are Google’s published docs and gallery pages.
You get the metrics that belong in a report, a Data Studio setup in four steps, and three ways to explain a change. Then come a one-page SEO report template, the tools compared, and the mistakes that make clients stop reading.
What Is SEO Reporting?
SEO reporting is collecting search performance data, usually from Google Search Console and Google Analytics, and presenting it on a schedule. A good report shows clicks, impressions, positions and conversions against a comparison period. It also explains the cause of each change and lists the next actions.
The data part is easy, since every tool exports numbers. The hard part is the commentary, because a chart without a sentence under it gets skimmed and forgotten.
So think of a report as three layers. The numbers show what happened, the notes explain why, and the next steps show what you will do about it. Most reports that clients ignore have only the first layer.
Reports also differ by reader.
A store owner wants one page about money, and a marketing manager wants the top queries too. An in-house SEO wants a live dashboard. Decide who reads it before you choose a single chart.
The same data can serve all three. Build one Data Studio report with a summary page for the owner and extra pages for the team. Send each reader only the page they need.
Which Metrics Belong in an SEO Report?
An SEO report needs four Search Console metrics, one conversion metric from Google Analytics and a comparison period. Clicks, impressions, CTR and average position show search visibility. Leads or sales show whether that visibility earned money, and the comparison shows whether this month is better or worse.
Everything else is optional. Backlink counts, crawl stats and keyword difficulty scores belong in an audit. A monthly page for the person who pays the invoice can leave them out.
Impressions vs Clicks
Search Console defines clicks as the number of times a user clicked your site from Google Search results. Impressions count how many times your site appeared in results, per the Performance report help page.
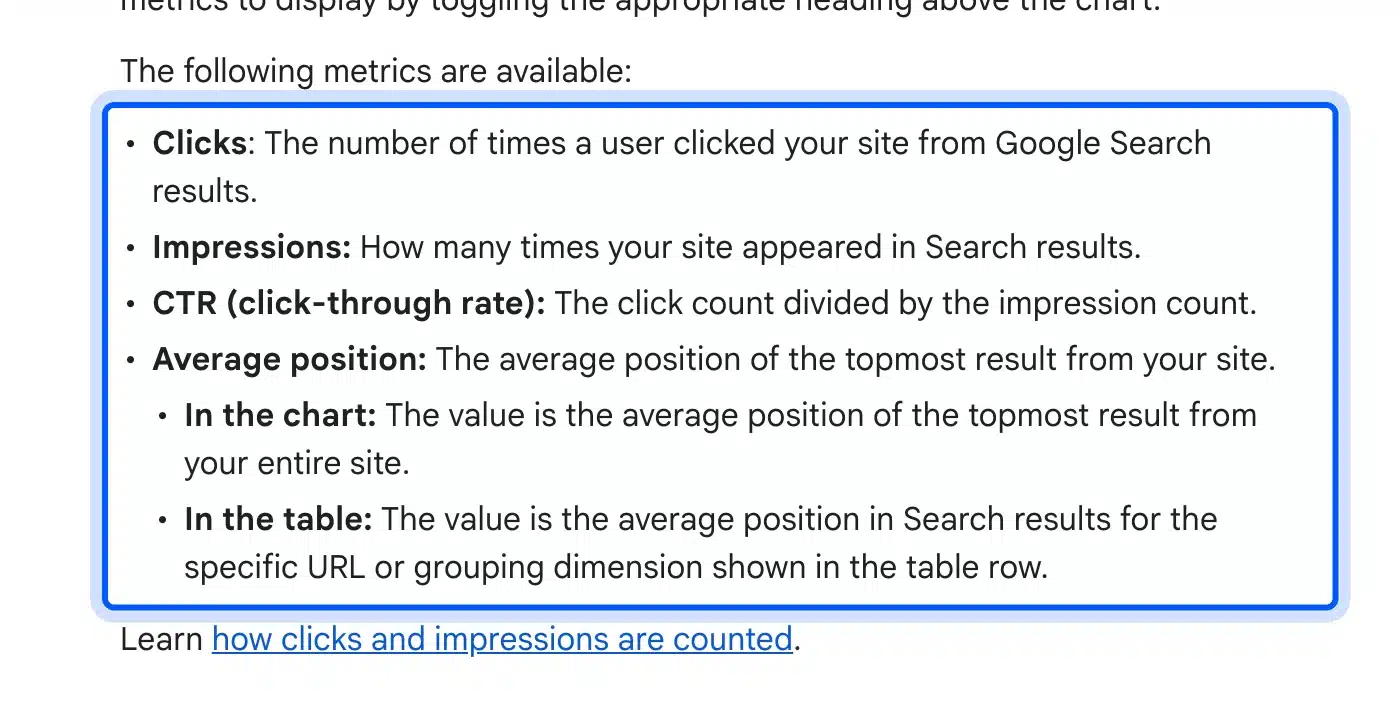
Impressions vs clicks is the first chart to explain. Rising impressions with flat clicks often means the site ranks for more queries, but lower on the page where few people click.
That is good news dressed as bad news. Say it in a sentence under the chart, or the client will read it as a drop in traffic.
Position Buckets
Average position on its own hides more than it shows, so group queries into position buckets instead. Four buckets work well: 1 to 3, 4 to 10, 11 to 20, and 21 and lower.
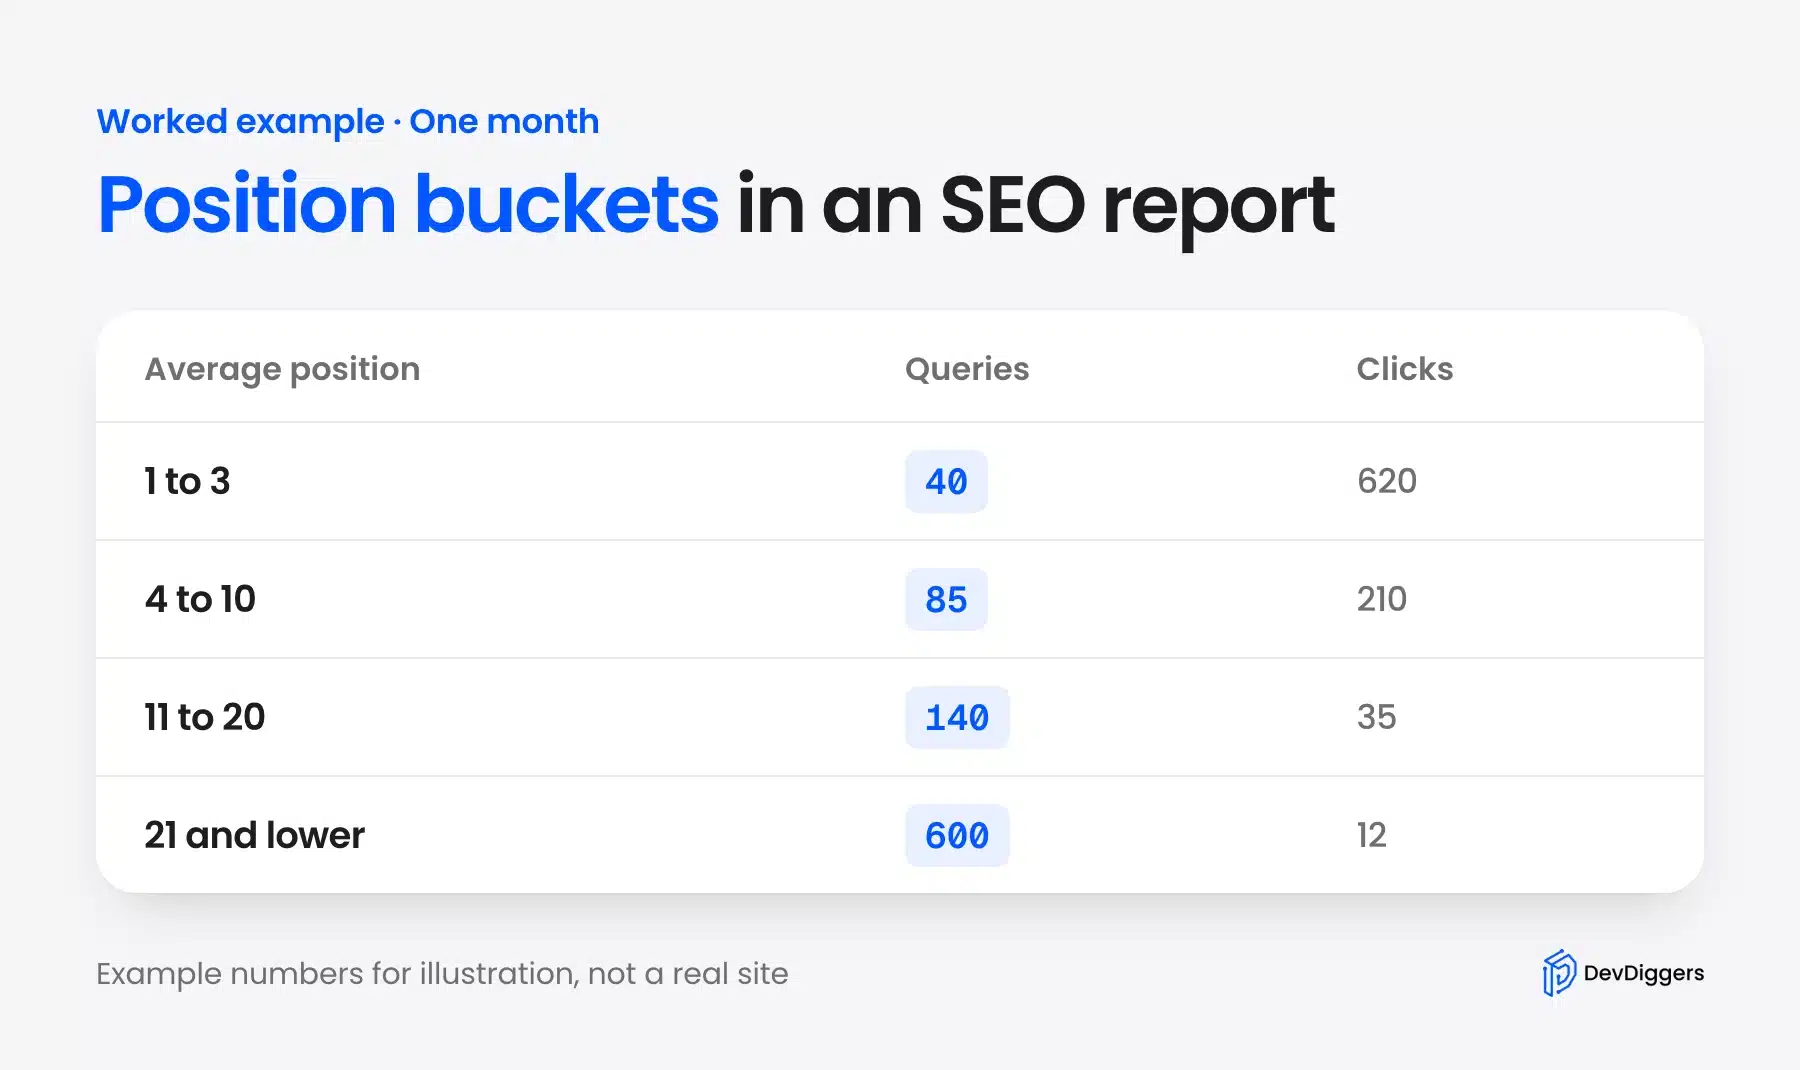
In the example above, 40 queries in the top 3 bring 620 clicks, while 600 queries below position 20 bring 12. The 140 queries in positions 11 to 20 are the ones to work on. A move onto page one changes their click count the most.
Search Console notes that average position in the chart is the topmost result for the whole site. In the table it is the position for that query or page, so build buckets from the table.
Conversions and Attribution
Search Console stops at the click, so conversions come from Google Analytics 4. Link the two products and GA4 shows Search Console queries next to its own engagement data.
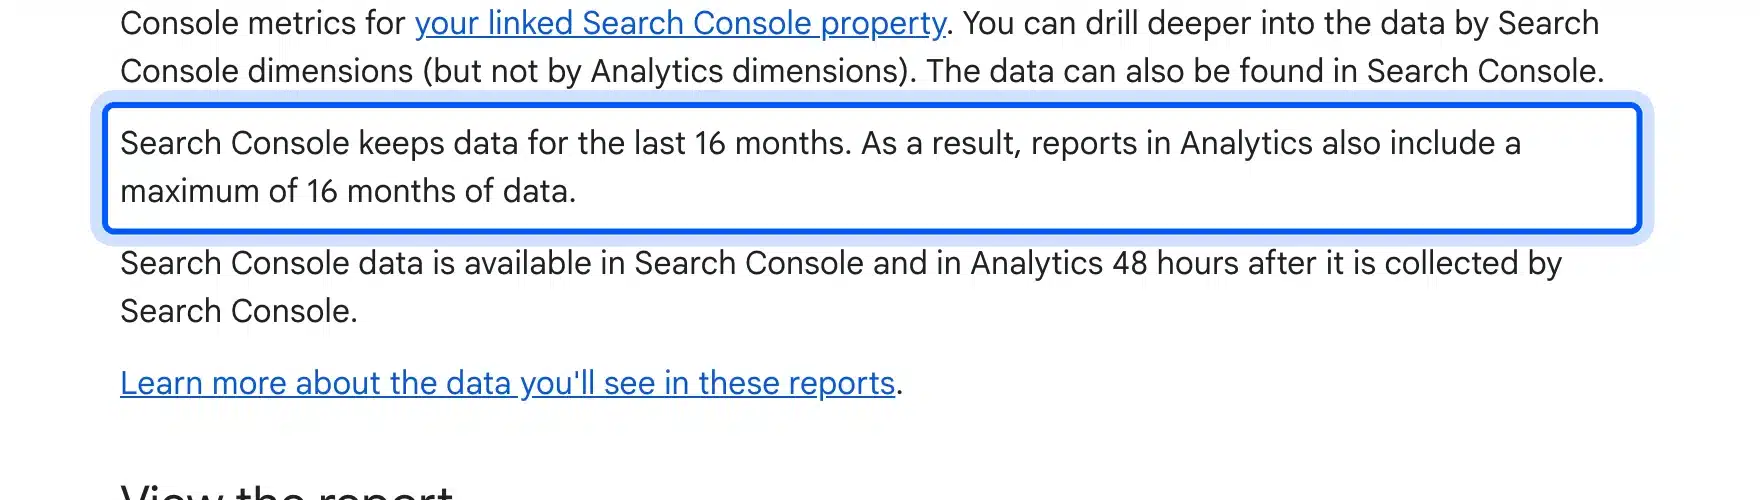
Two limits from the Google Analytics help on Search Console data shape every report. Search Console keeps data for the last 16 months, and new data reaches both tools after 48 hours.
Attribution is the next caveat. GA4 credits a sale to a channel by its attribution model.
A buyer who first found you in search and came back by email may not count as organic. Say which model you report on, and keep it the same every month.
How to Create an SEO Report in Data Studio
You can create an SEO report in Data Studio, the free Google tool formerly called Looker Studio, in four steps. Connect the Search Console data source, then start from a template instead of a blank page. Add GA4 conversions next, and finish by scheduling a PDF delivery to the client.
Data Studio needs a Google sign-in and view access to the Search Console property. Use the same Google Account for both, or the property will not appear in the connector list.
Step 1: Connect the Search Console Data Source
Create a data source and pick the Search Console connector. The Data Studio connector guide explains that one data source can use only one table: Site Impression or URL Impression.
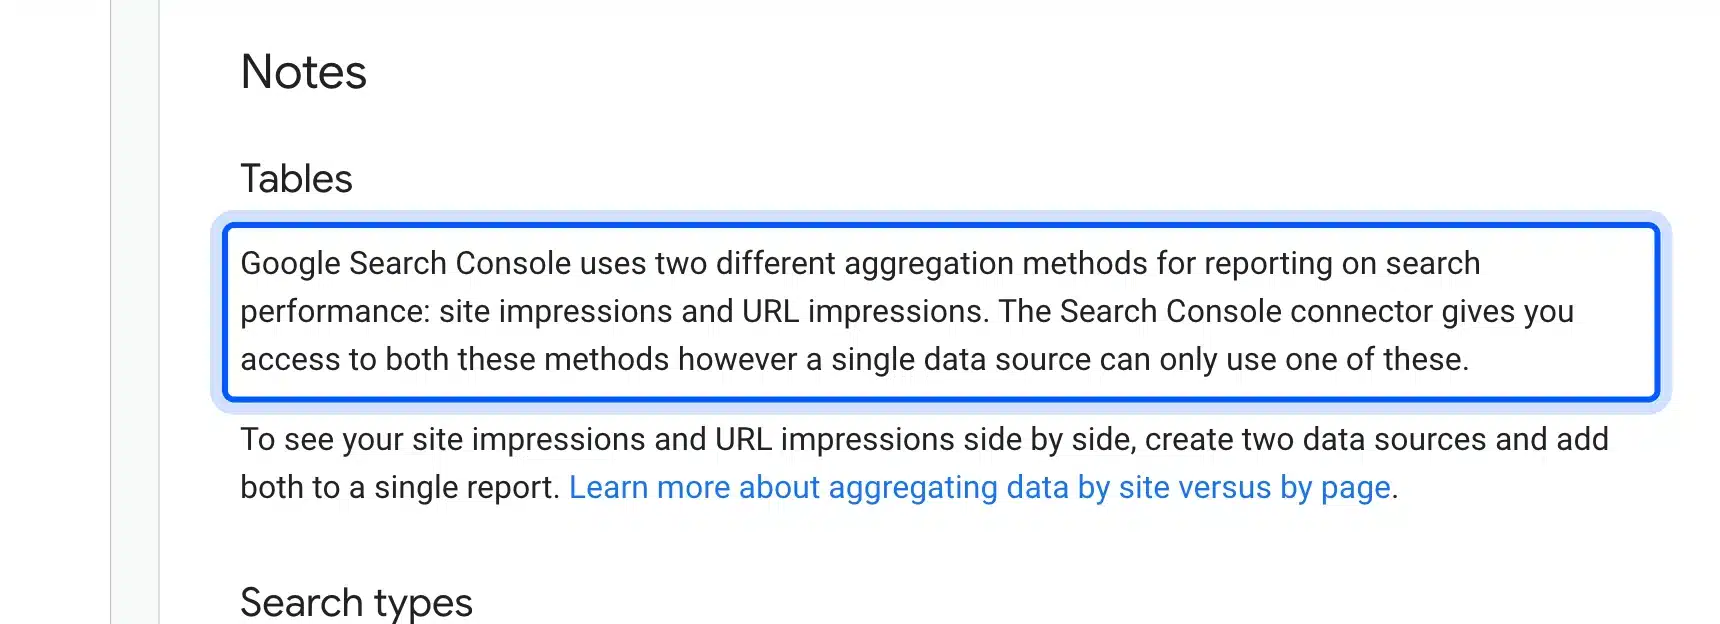
Use Site Impression for the totals chart and URL Impression for the top pages table. The connector guide says to create two data sources and add both to one report to see them side by side.
Step 2: Start From a Template
A blank report takes hours to lay out, so start from a template. The public Data Studio Report Gallery lists Search Console templates, such as the All-in-one Search Console Template by Data Bloo.
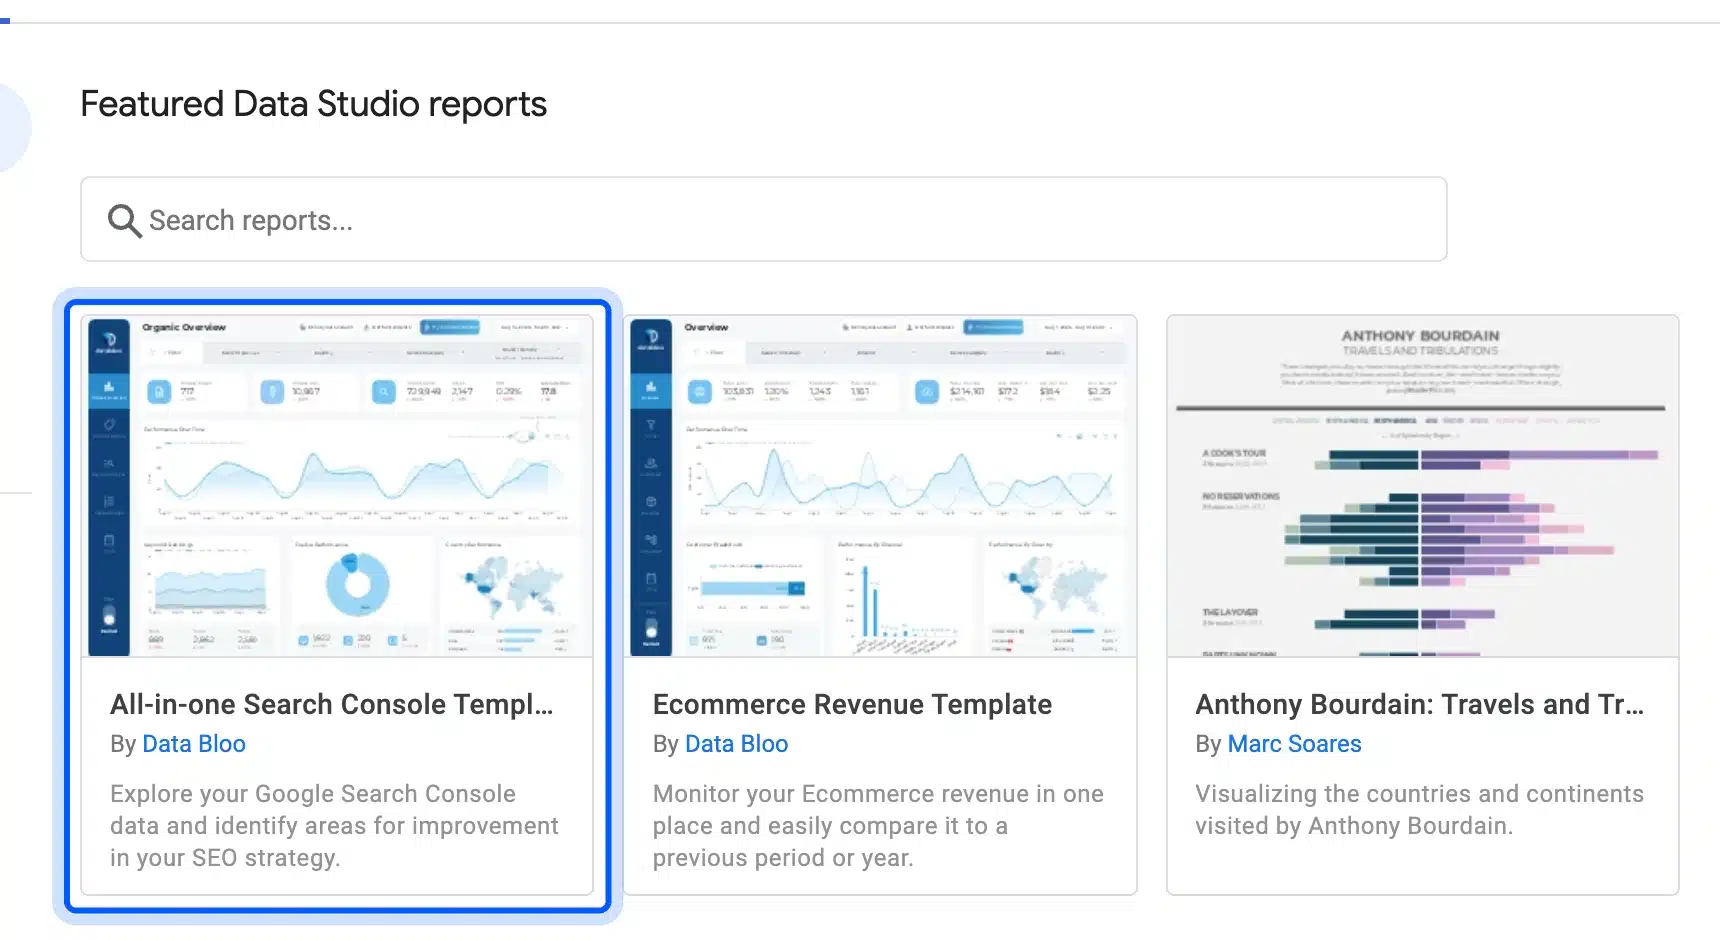
Copy the template, swap its data source for yours, and then delete pages. If the template has several pages, keep the one that answers the client’s goal.
Step 3: Add GA4 Conversions
Add a Google Analytics data source for the same site, and add one scorecard for the conversion that matters. That might be leads, purchases or revenue, filtered to the Organic Search channel.
To practice before touching client data, the Google Analytics demo account holds real data from the Google Merchandise Store. Any Google user can open it, and it adds itself to your account list.
Step 4: Schedule Delivery
The last step turns the report into a monthly SEO report that arrives on its own. Data Studio can email a PDF on a schedule, with a link back to the live report.
Open the report, click Share, then Schedule delivery, and pick the recipients and the day. Set it for the third of each month, which leaves time for the 48 hour data delay.
Building and keeping a client template takes real hours every month. If you would rather hand that off, our WordPress SEO services include monthly reporting on the work we do.
How to Explain Changes in a Monthly SEO Report
A monthly SEO report earns trust by explaining every large move in clicks or impressions. Three tools do most of that work. Annotations record what you changed, a 16 month view shows seasonality, and a date comparison isolates the queries and pages that moved.
Write the explanation first, then pick the chart that proves it. A client remembers the sentence long after the line on the chart is forgotten.
Annotations
Search Console added custom annotations to its performance reports in November 2025. Google’s announcement on custom annotations says you right-click the chart, choose Add annotation and write a note of up to 120 characters.
Mark every launch, migration, title rewrite and plugin change on the day it happened. Everyone with access to the property sees the notes, so keep client names and private details out of them.
Seasonality
Google’s guide to debugging drops in search traffic suggests setting the date filter to the last 16 months. That shows whether a drop happens every year around the same holiday or trend.
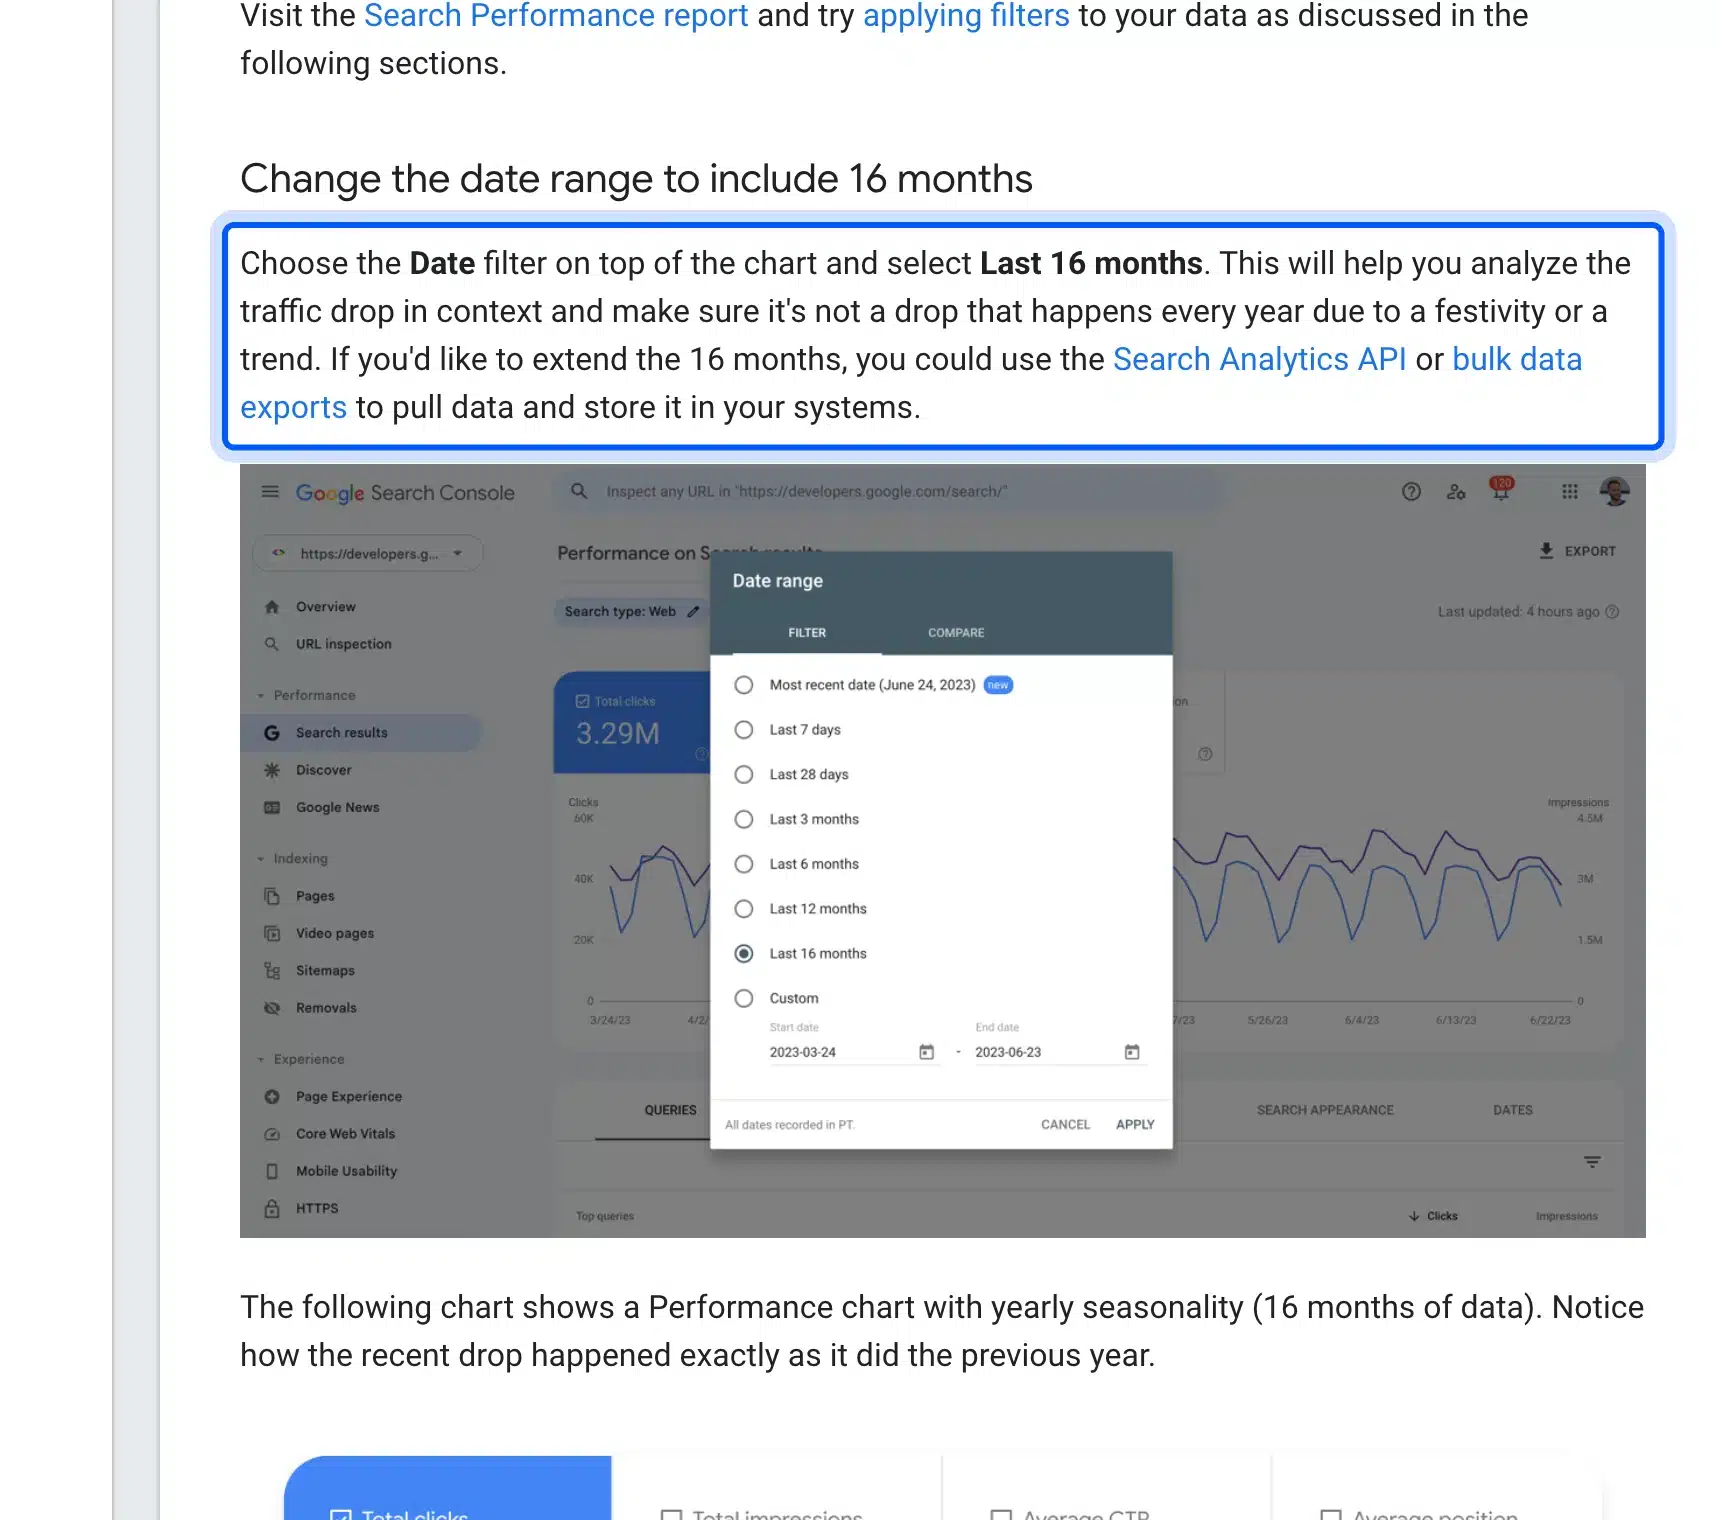
A store that sells winter coats loses clicks every spring. Without the year before on the same chart, that normal drop looks like a failure.
Since Search Console keeps only 16 months, export the monthly totals to a sheet. In two years you will want a three year view, and the data will be gone.
Compare Periods
The same Google guide suggests the Compare tab with last 3 months against the previous period, or year over year. Then click through the Queries, Pages, Countries, Devices and Search appearance tabs to find where the change sits.
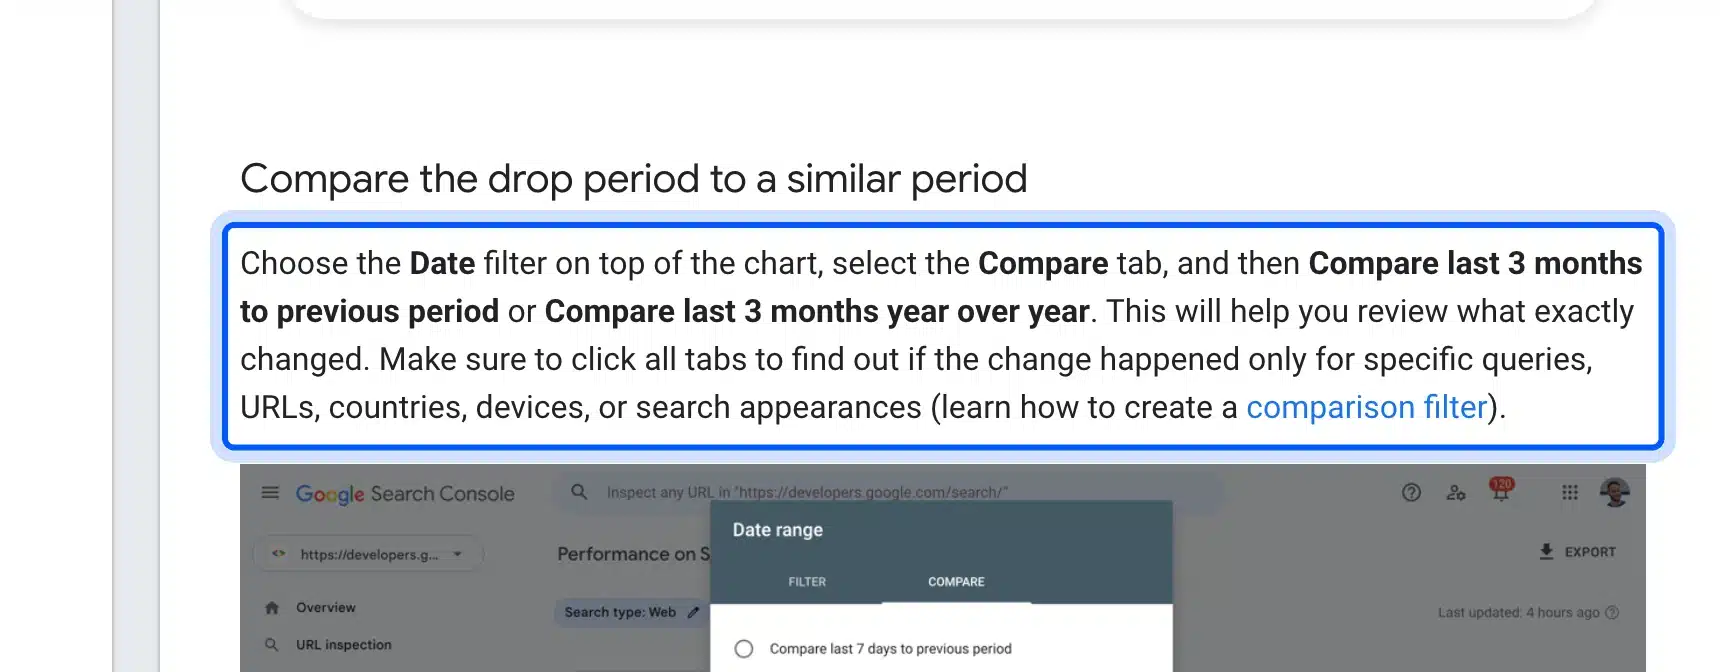
Year over year is the fairer comparison for most businesses. Month over month is fine for a new site with no history, or for checking a change you made last month.
Tip: Put the comparison period in the report title, such as “September 2026 vs September 2025”. A period shown only in a date filter is easy to miss.
SEO Report Template
An SEO report template keeps every month in the same shape, so a client can find the number they care about in seconds. Our template has seven sections on one page. Each section answers one question, and the summary at the top answers the question the client asks first.
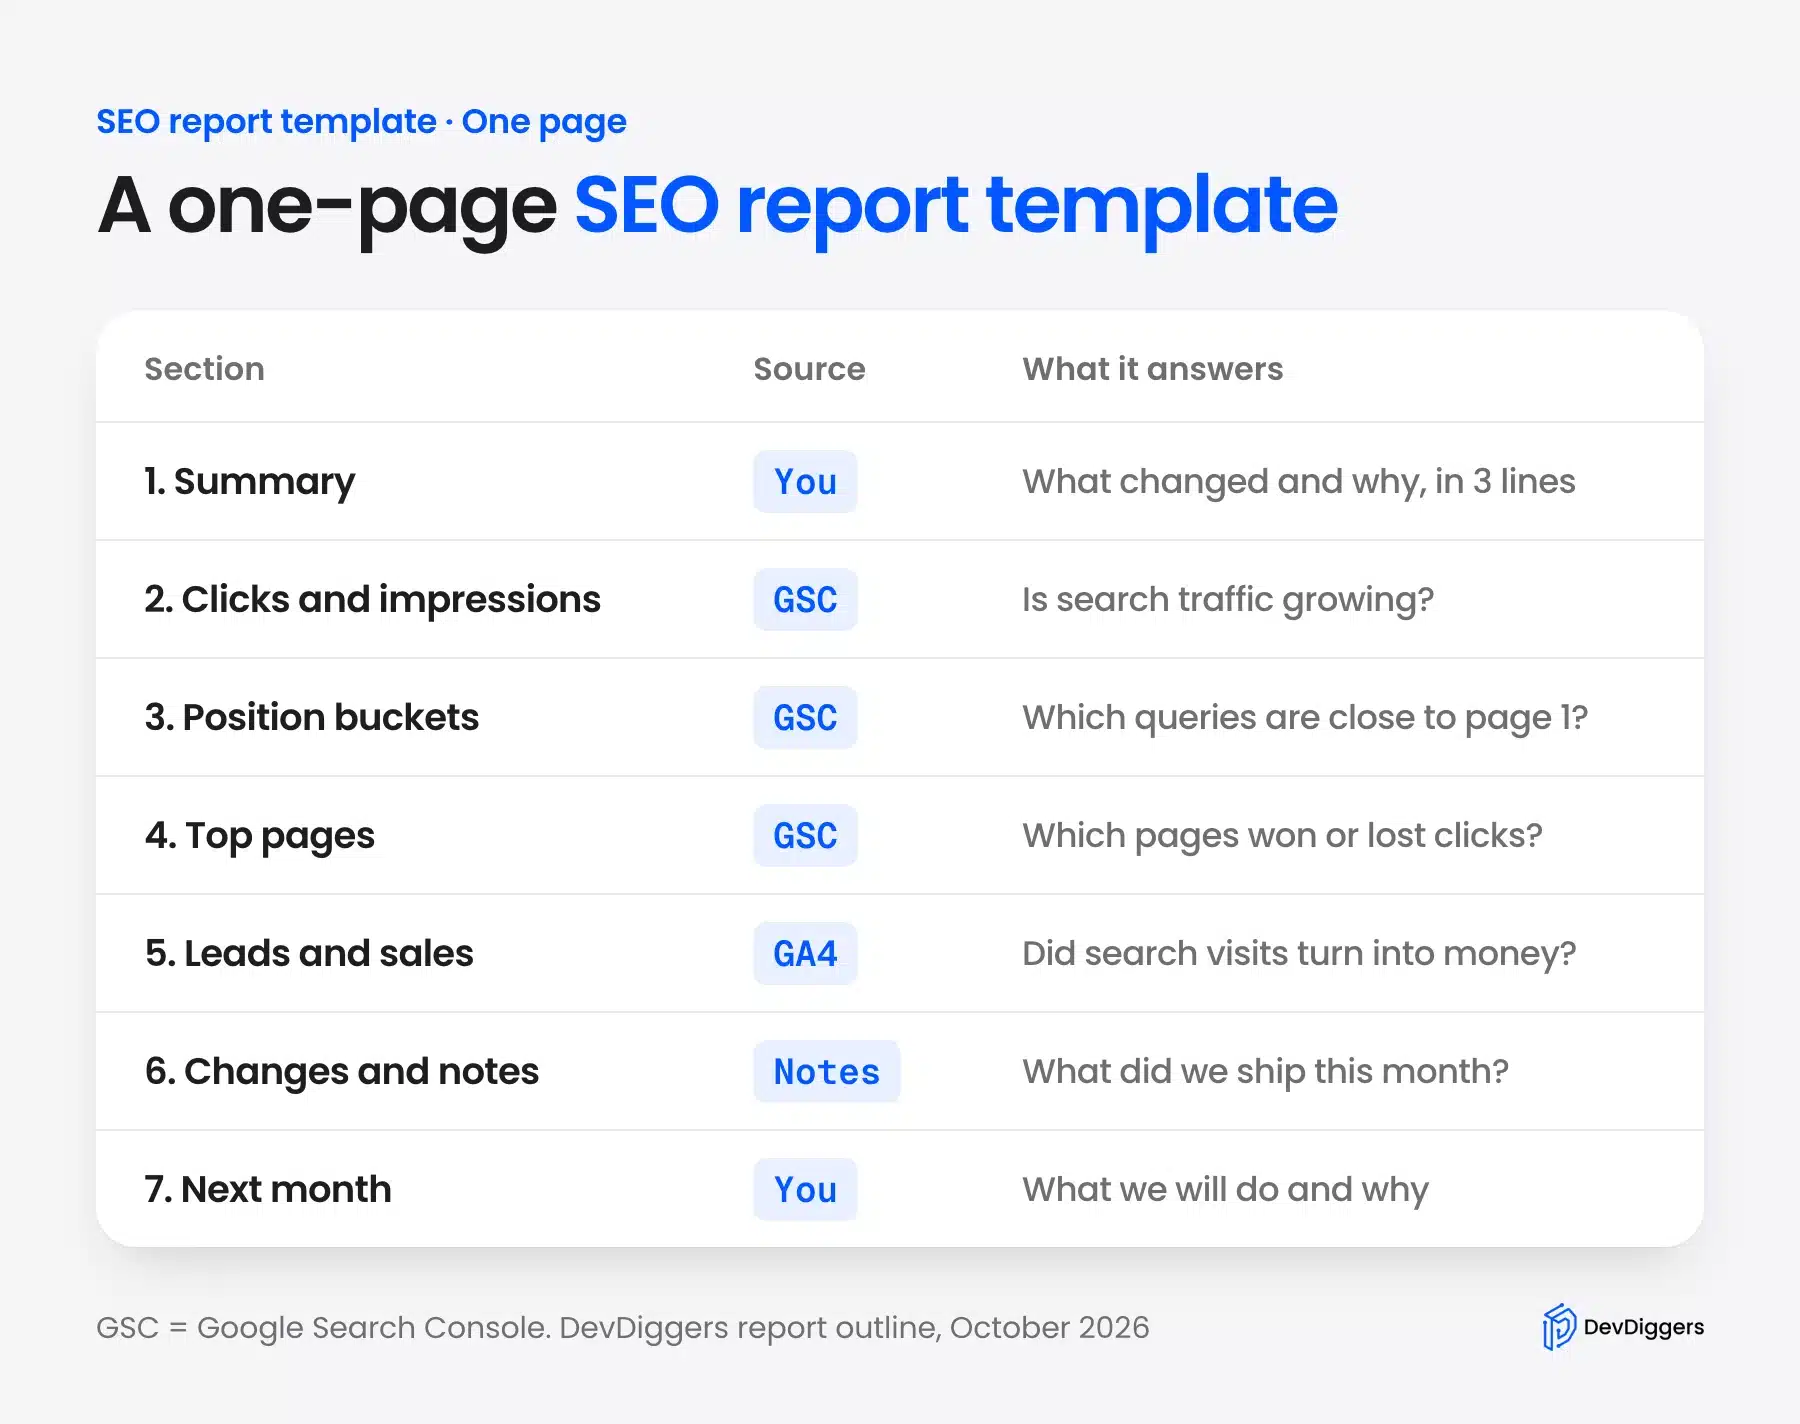
Here is what goes in each section:
- Summary: Three sentences on what changed, why, and whether the month was good. Write it last.
- Clicks and impressions: One chart with this month against the same month last year.
- Position buckets: The four bucket counts, with the 11 to 20 bucket called out.
- Top pages: Five pages that gained the most clicks and five that lost the most.
- Leads and sales: One GA4 number from organic search, with the attribution model named.
- Changes and notes: The month’s annotations rewritten as plain sentences.
- Next month: Three actions, each with an owner and a reason.
How do you write the commentary? Lead with the cause, then the number. “Clicks fell 18% because the Black Friday pages expired” reads better than the reverse, and it answers the next question before the client asks it.
Keep the template on one page even when the data tempts you to add more. A second page invites skimming, and the report you spent a day on turns into a forwarded PDF.
What Are SEO Reporting Tools?
SEO reporting tools are the apps that pull search data and turn it into charts, tables or scheduled reports. The free core is Google Search Console for search data, GA4 for conversions and Data Studio for layout and delivery. Paid tools add rank tracking, backlink data and white-label branding.
| Tool | Cost | Data it adds | Best use in a report |
|---|---|---|---|
| Google Search Console | Free | Clicks, impressions, CTR, position for 16 months | The core search numbers |
| Google Analytics 4 | Free | Sessions, conversions, revenue by channel | Leads and sales from organic search |
| Data Studio | Free (Pro is paid) | Layout, blended sources, PDF scheduling | The report itself |
| Paid SEO suites | Monthly fee | Rank tracking, backlinks, competitor data | Extra pages for in-house teams |
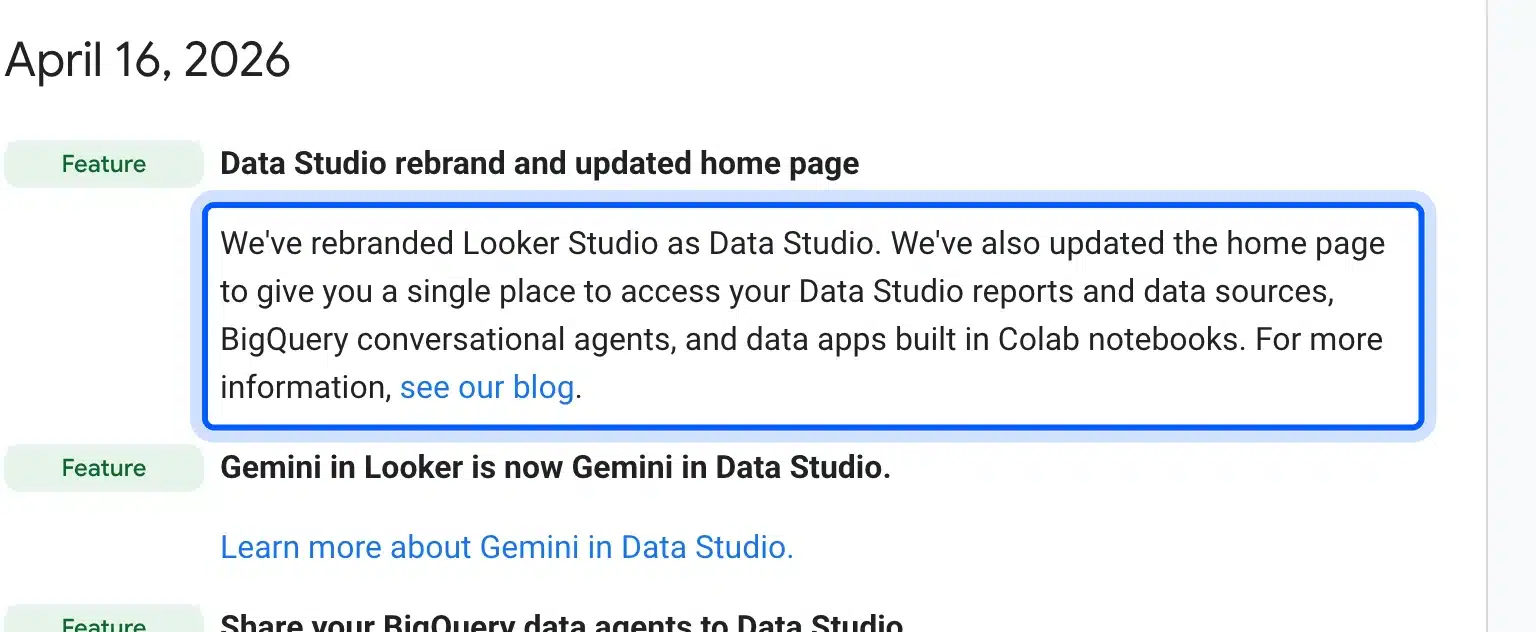
One naming change catches people out in 2026. Google’s Data Studio release notes for April 16, 2026 say Looker Studio was rebranded as Data Studio. Existing reports kept working, but older tutorials still use the Looker Studio name.
Paid tools earn their fee when the client asks about competitors or rankings outside Google’s data. For a monthly page that answers “did search bring us business”, the free three cover it.
Add one more free tool to the list: a plain spreadsheet. Copy each month’s totals for clicks, impressions, average position and conversions into one row. Search Console drops anything older than 16 months, and that sheet becomes the only long history the client has.
A spreadsheet also makes the year over year chart easy to rebuild. When a client asks how this October compares with the one two years ago, you can answer from the sheet in a minute.
How to Make an SEO Report for a Client
To make an SEO report for a client, agree on the one goal it tracks and send it on the same day each month. Pull the data, bucket positions and mark changes. Explain the moves, set three next steps, and walk the client through it.
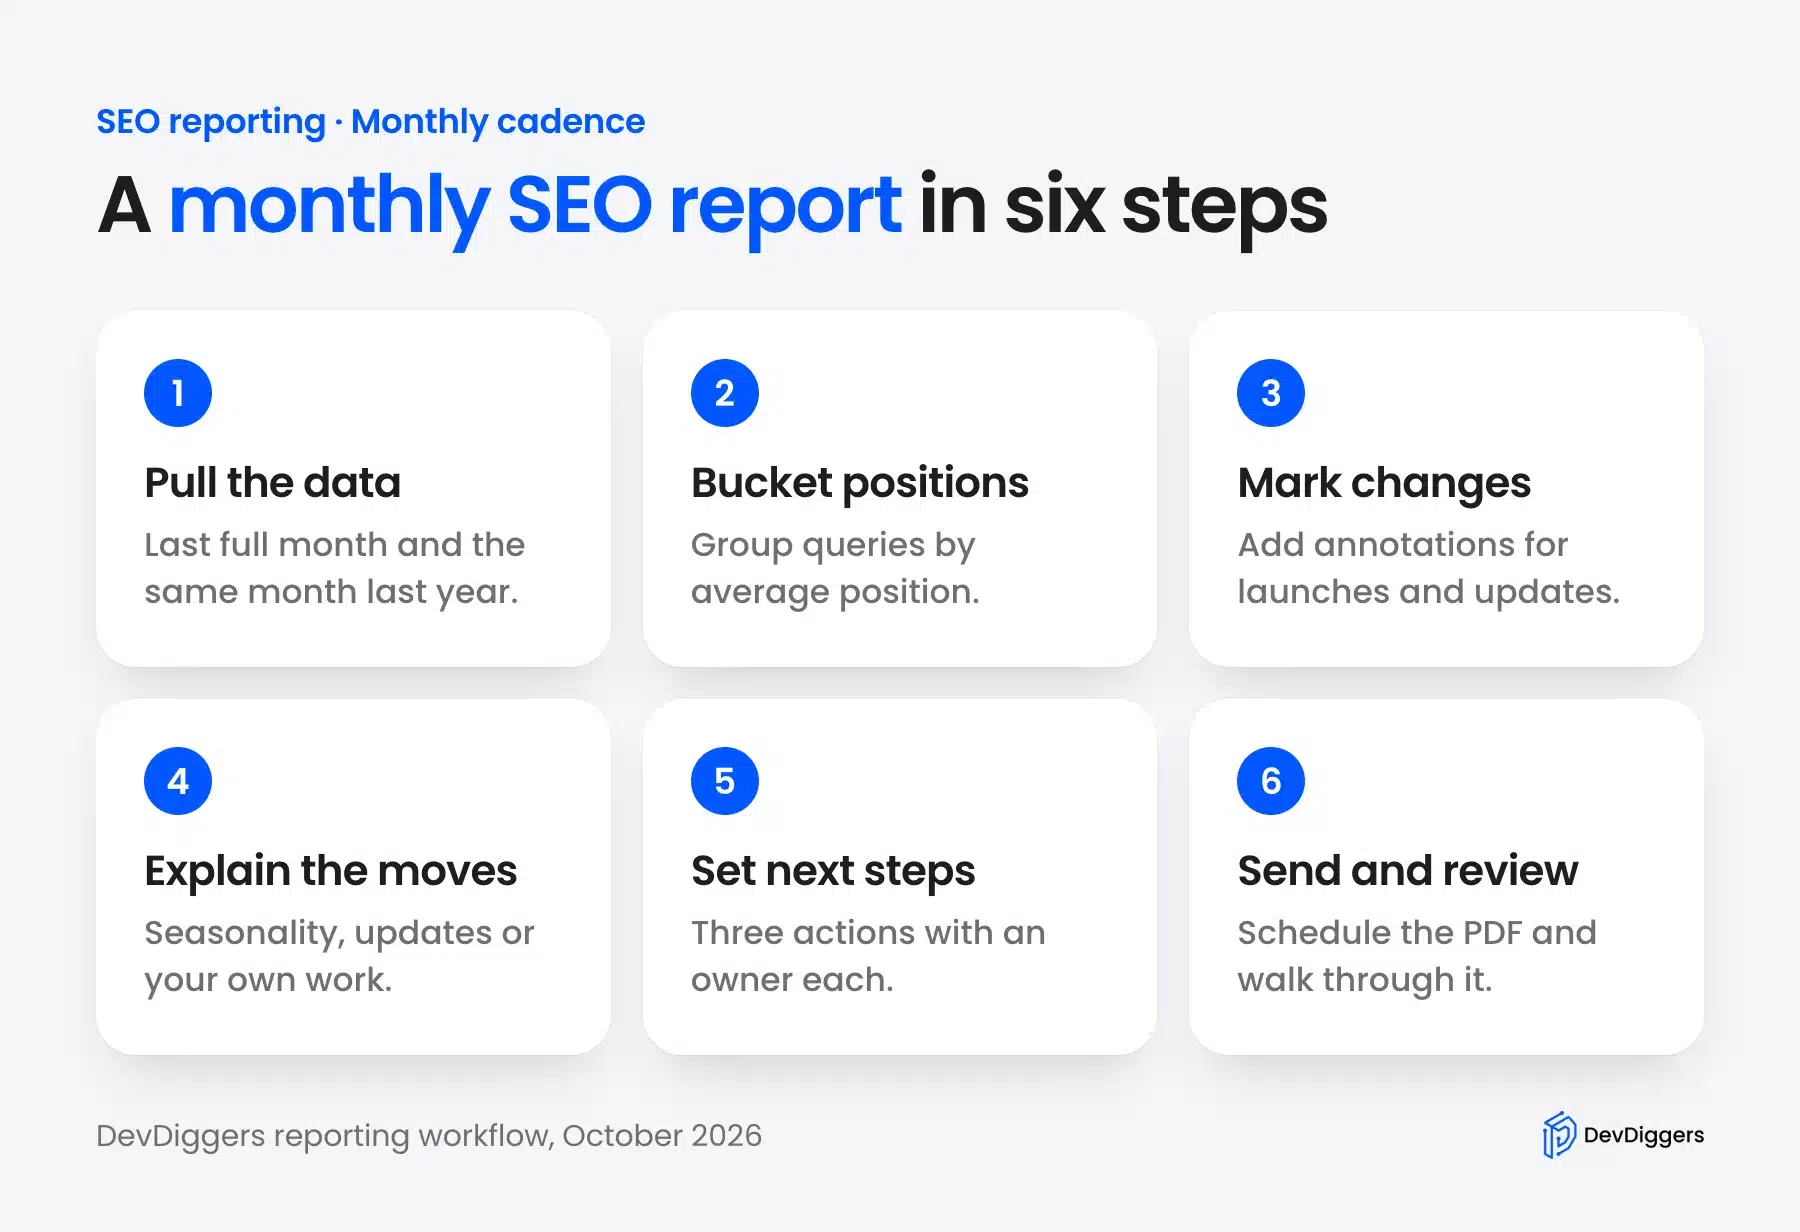
Cadence matters more than design. A plain report sent on the third of every month beats a beautiful one that shows up whenever someone finds time.
Agree on the goal in the first month and write it at the top of every report. If the goal is leads, the report leads with leads, even in a month when impressions doubled.
Book a 15 minute call for the first three reports. Any question the client asks on that call belongs in the next report’s summary.
Sort out access before the first report. The client should own the Search Console property and add you as a user. Google’s permissions guide lists three levels: owner, full user and restricted user.
A full user can view all data and take some actions, which covers reporting work. If an agency owns the property instead, the client loses its own history the day the contract ends.
The same rule applies to Google Analytics and the Data Studio report. Keep them in the client’s account and share edit access, so the report survives a change of agency.
Note: Never report a metric you cannot explain. If a number moved and you do not know why, say so and say what you will check, which builds more trust than a guess.
Common SEO Reporting Mistakes
Most SEO reports fail because they show data without a point. The usual mistakes are reporting rankings alone, mixing date ranges, and hiding a bad month. Each one makes the client trust the report less, and a report the client does not trust gets cut first when budgets shrink.
Watch for these in your own reports:
- Rankings with no clicks: A keyword at position 3 that brings no visits is a vanity number. Report the clicks next to it.
- Mixed date ranges: A chart for 28 days next to a table for the calendar month confuses everyone. Use the full calendar month everywhere.
- No comparison period: A number with nothing to compare it with means nothing. Year over year is the default.
- Too many pages: Ten pages of charts hide the one change that matters. Keep it to one page plus an appendix.
- Silence on bad months: A drop explained early is a conversation. A drop the client finds alone is a lost account.
If your site’s content is losing clicks month after month, our guide to content decay identification shows how to find the pages behind it. For AI answers, which Search Console does not report as a separate source, see how to measure AI search visibility.
Fixes found in a report usually sit on the page itself. The on-page SEO checklist covers the 18 checks to run before a page goes live again.
Conclusion
SEO reporting works when one page answers what changed, why it changed, and what you will do next. Build it on Search Console and GA4, lay it out in Data Studio, and send it on the same day every month.
Group queries into position buckets, mark every change with an annotation, and compare against the same month last year. Those three habits explain most of the moves a client will ask about.
Start with the seven section template above. Adjust it to the client’s goal, and keep it to one page.
Frequently Asked Questions (FAQs)
Q1. How often should you send an SEO report?
Monthly suits most businesses, because search data moves slowly and Search Console needs 48 hours to settle. Weekly reports are useful only during a migration or a big launch, when you need to catch problems fast.
Q2. How do you write an SEO report?
Write the summary last and put it first: three sentences on what changed, why, and what is next. Then add the charts that prove each sentence, and cut any chart that does not support one.
Q3. Can you make an SEO report for free?
Yes. Google Search Console, Google Analytics 4 and Data Studio are all free, and Data Studio can email a scheduled PDF without a paid plan. Paid tools only add rank tracking, backlinks and white-label branding.
Q4. What is the difference between an SEO audit and an SEO report?
An audit is a one-time check of a site’s technical and content health, with a fix list. A report tracks results over time, month after month. Our guide on technical SEO vs content SEO covers what an audit checks.
Q5. Why do Search Console and Google Analytics show different numbers?
They count different things. Search Console counts clicks from Google Search results, while GA4 counts sessions it records on the site and credits them by its attribution model. Expect a gap and report each number from its own source.
Q6. How long should an SEO report be?
One page for the client, plus an optional appendix for anyone who wants the detail. If the summary needs more than three sentences, the month probably needs a call instead of a longer report.
Q7. What should a new site report on before it has traffic?
Report indexing and impressions first, since clicks come later. Confirm the site is in Google with our guide on how to submit your site to Google Search, then track impressions growth month by month.