

A Core Web Vitals test measures how fast a page’s main content loads, how fast it reacts to a tap and how much it jumps. Google grades them as LCP, INP and CLS, and the free tools below show you all three in about ten minutes.
We ran every test here on our own site in October 2026, on the devdiggers.com homepage and one blog post. That meant PageSpeed Insights, ten Lighthouse 13.5 runs in Chrome, CrUX Vis and the web-vitals 6.2 library with real taps on a phone-sized screen. The results did not agree with each other, and the gap is the most useful thing a test can show you.
You will see how to run each tool step by step and how to read lab data against field data. Then you get our own numbers. The last sections cover what each score means, how to fix it, and which free checker fits which job.
What Is a Core Web Vitals Test?
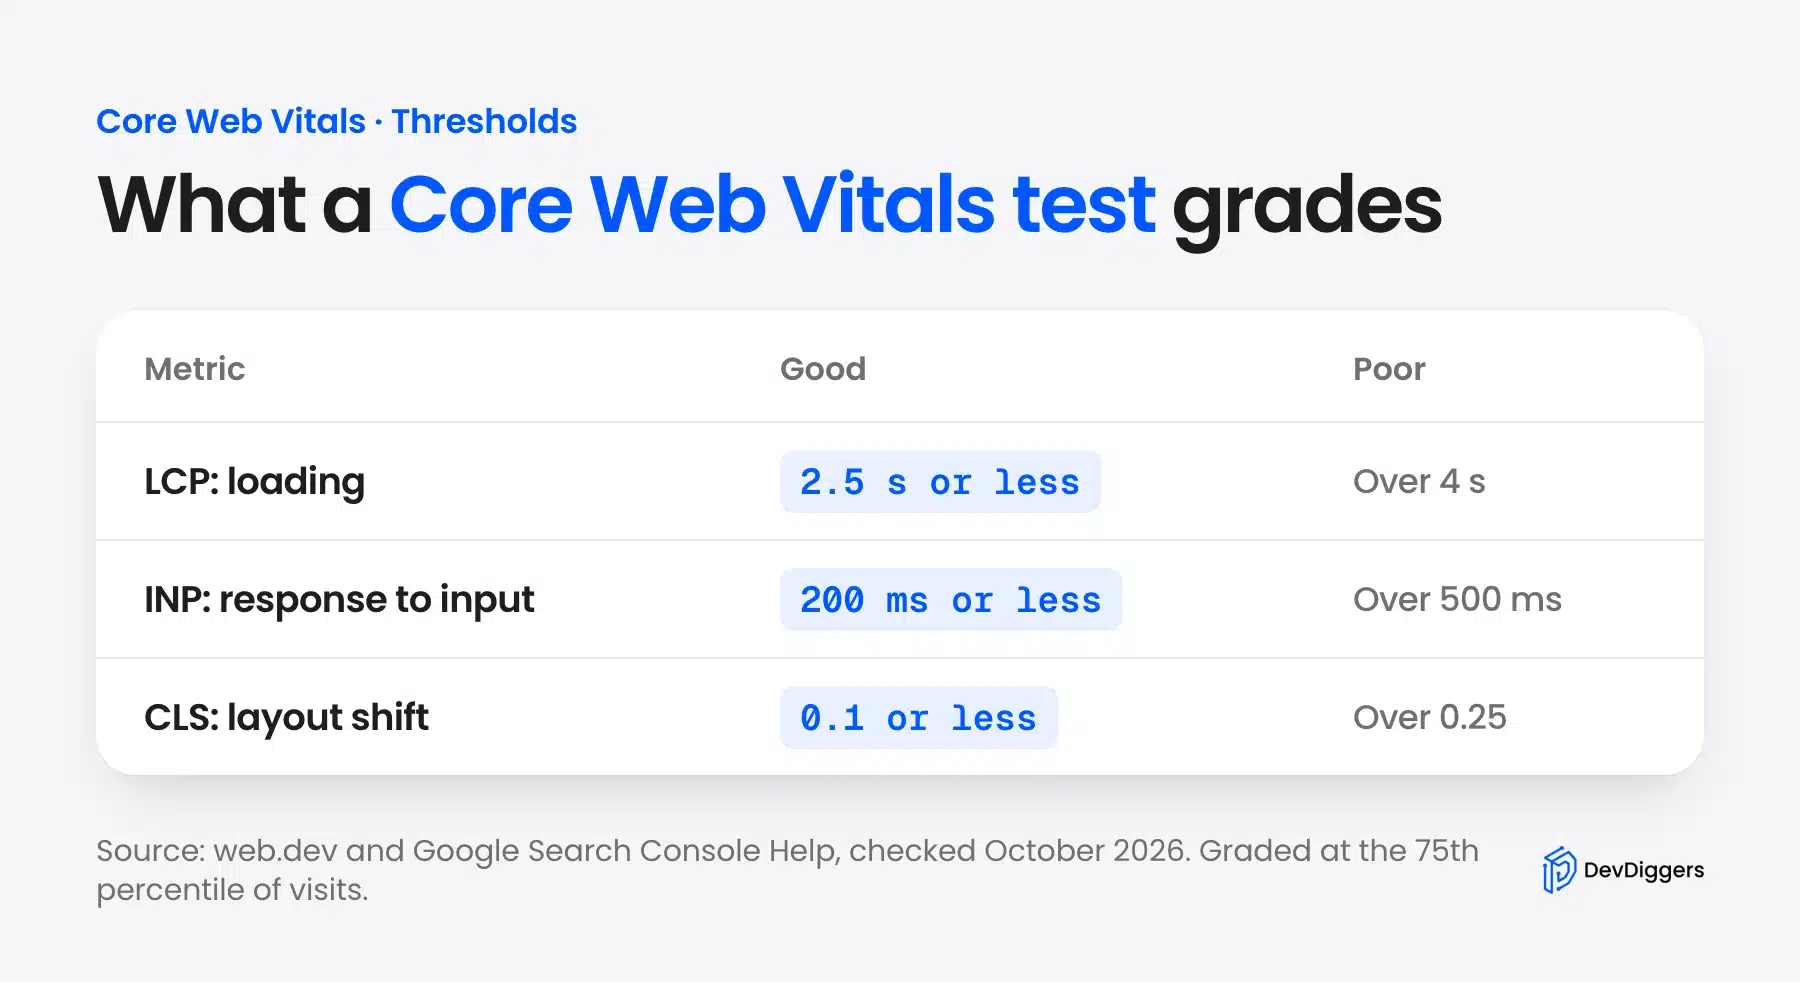
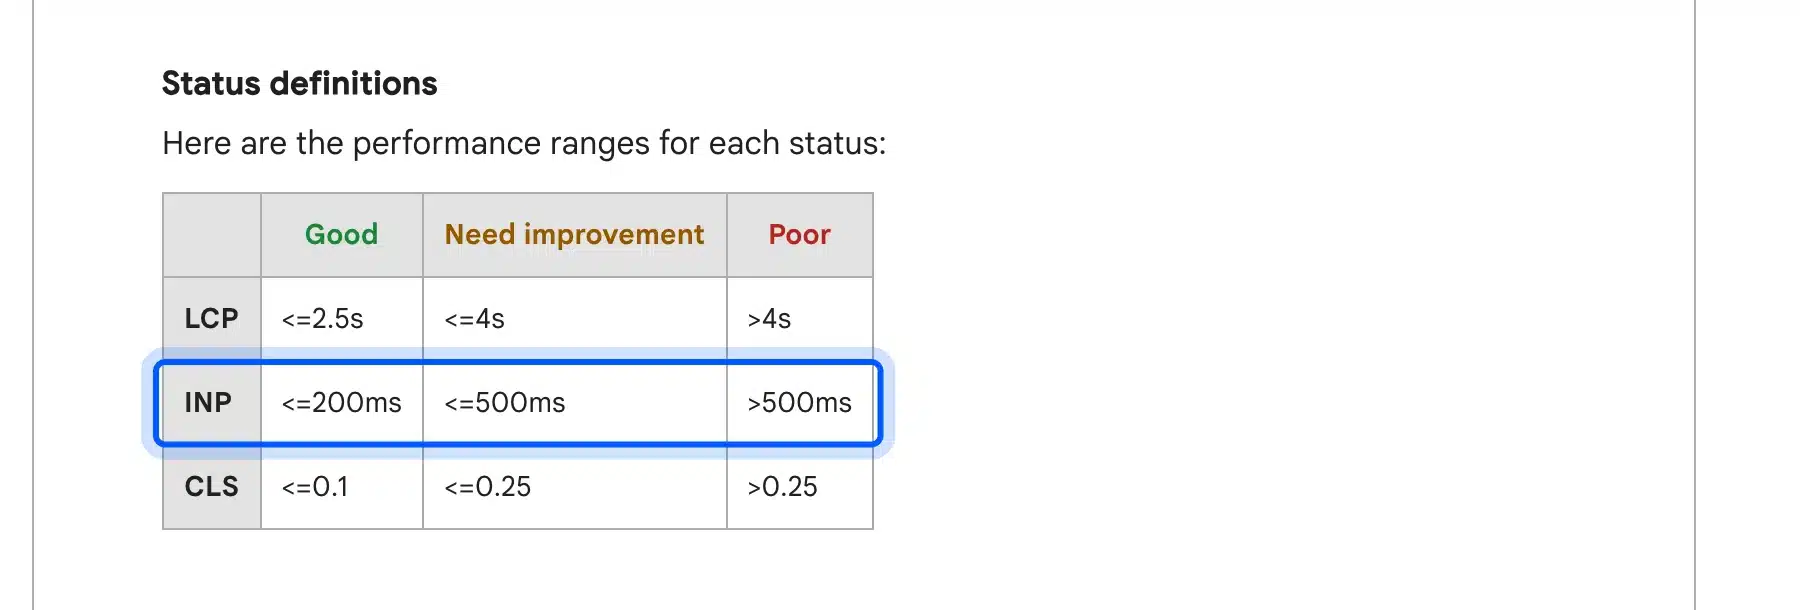
A Core Web Vitals test checks a URL against Google’s three user experience metrics and their limits. A page passes when LCP is 2.5 seconds or less, INP is 200 milliseconds or less, and CLS is 0.1 or less. Google grades each limit at the 75th percentile of real visits.
Those numbers come straight from Google’s Web Vitals guide on web.dev, which also says the 75th percentile is the right point to measure. So a page does not pass because most visits were fast. It passes when three out of four visits were fast on every metric.
The three metrics measure different moments of a visit:
- LCP (Largest Contentful Paint): The time until the biggest image or text block in the first screen appears.
- INP (Interaction to Next Paint): The delay between a tap, click or key press and the next frame the browser paints.
- CLS (Cumulative Layout Shift): A score for how far visible content moves without the visitor asking it to move.
INP replaced First Input Delay in March 2024. The web.dev launch post says Chrome then deprecated FID support, so any guide still grading FID is out of date. Every tool in this post reports INP.
How to Run a Core Web Vitals Test
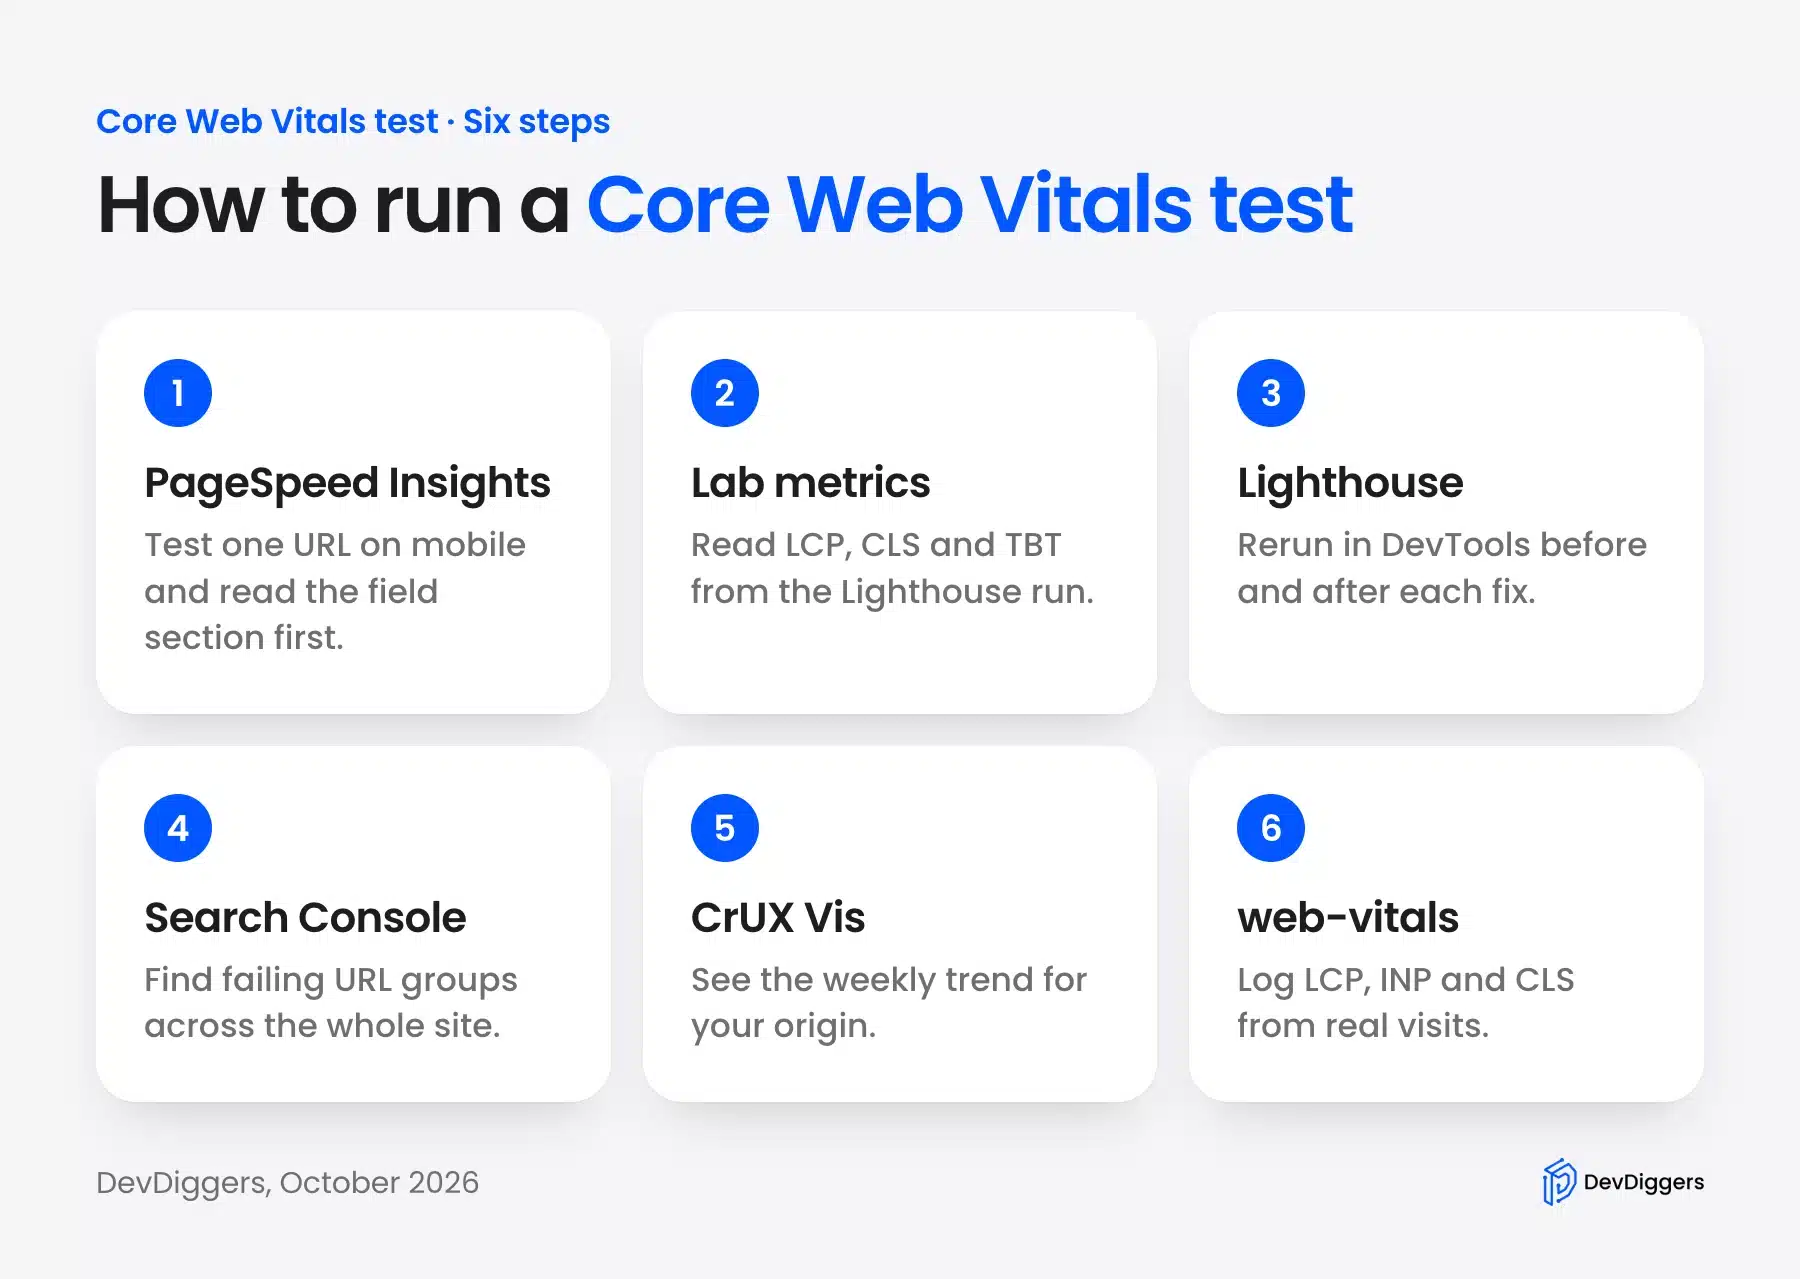
You can run a Core Web Vitals test with six free tools, starting with PageSpeed Insights and its lab metrics. Then use Lighthouse, Search Console, CrUX Vis and the web-vitals library. The last one is the only way to see real INP on a site with little traffic.
Each step below says what to click and shows the screen we got on our own pages. Run them on your homepage and one high-traffic page, because a template problem shows up on every page that uses it.
Step 1: Test the URL in PageSpeed Insights
PageSpeed Insights is the fastest Core Web Vitals check because it shows lab data and real-user field data on one screen. Paste a URL, press Analyze, and read the top section before you look at the score.
- Open the tool: Go to PageSpeed Insights and paste the full URL, including https.
- Keep the Mobile tab: Google tests mobile first, and mobile is where most pages fail.
- Read “Discover what your real users are experiencing”: This is the field data. It decides whether the page passes.
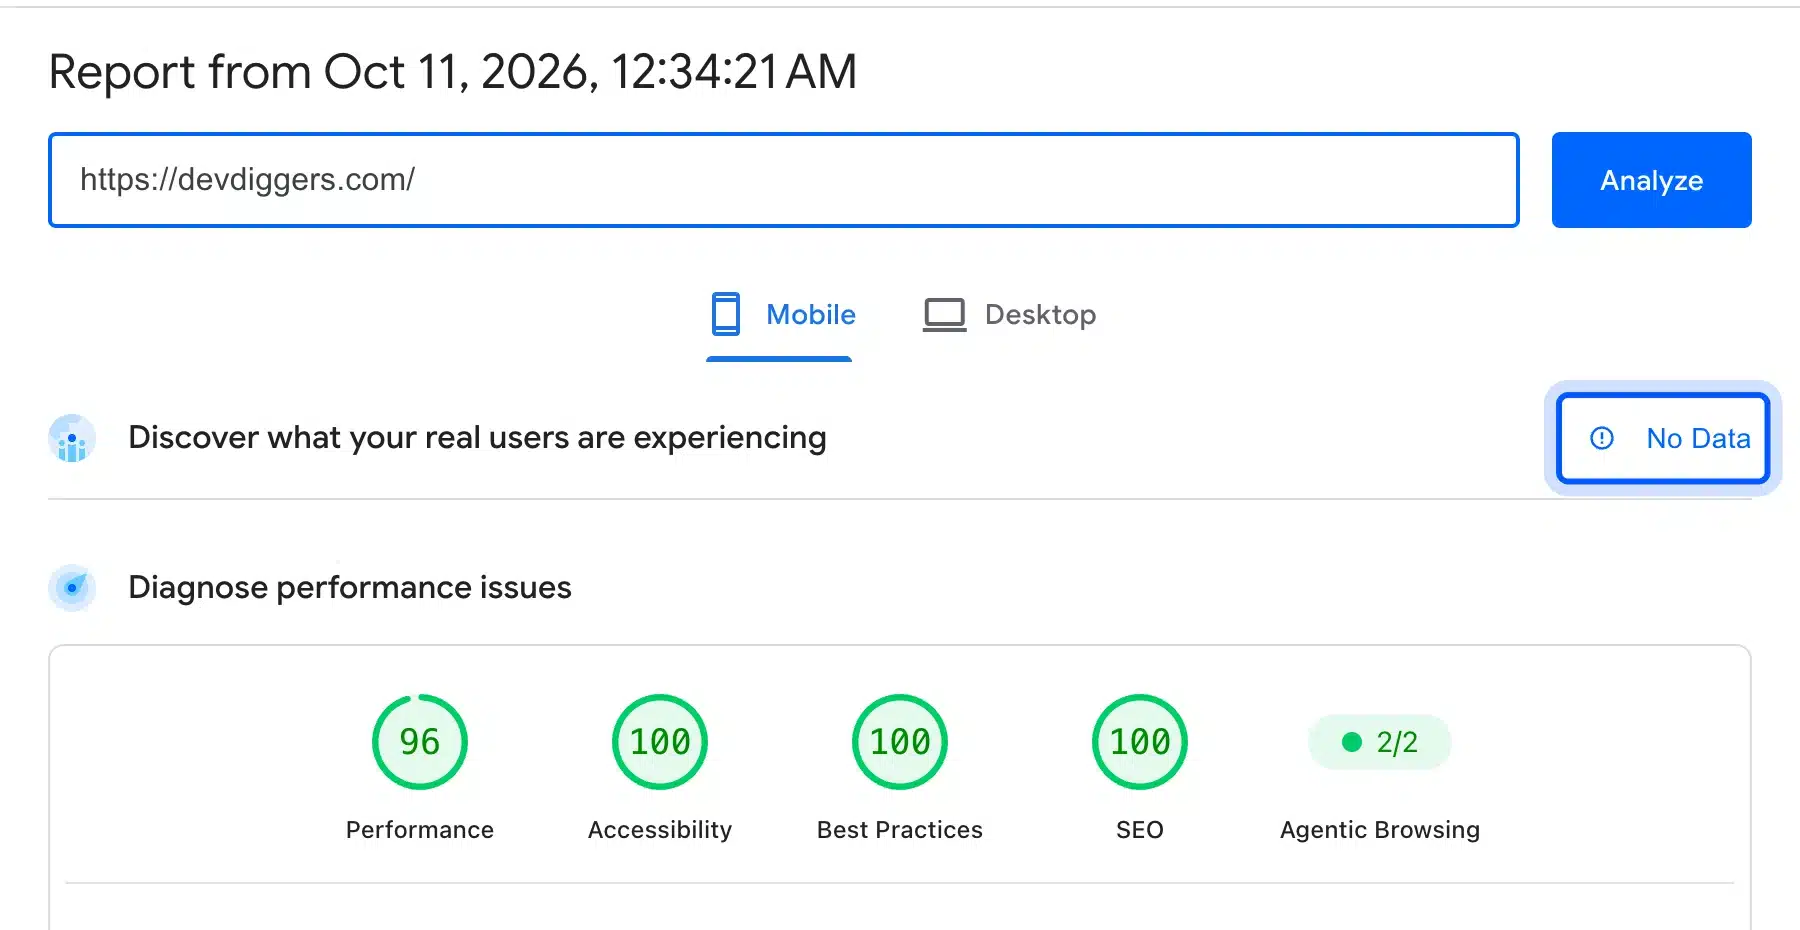
Our homepage got a 96 performance score and “No Data” for real users. Google’s PageSpeed Insights documentation explains why. Field data needs enough Chrome visits in the last 28 days, and PSI falls back to the whole origin before it shows nothing.
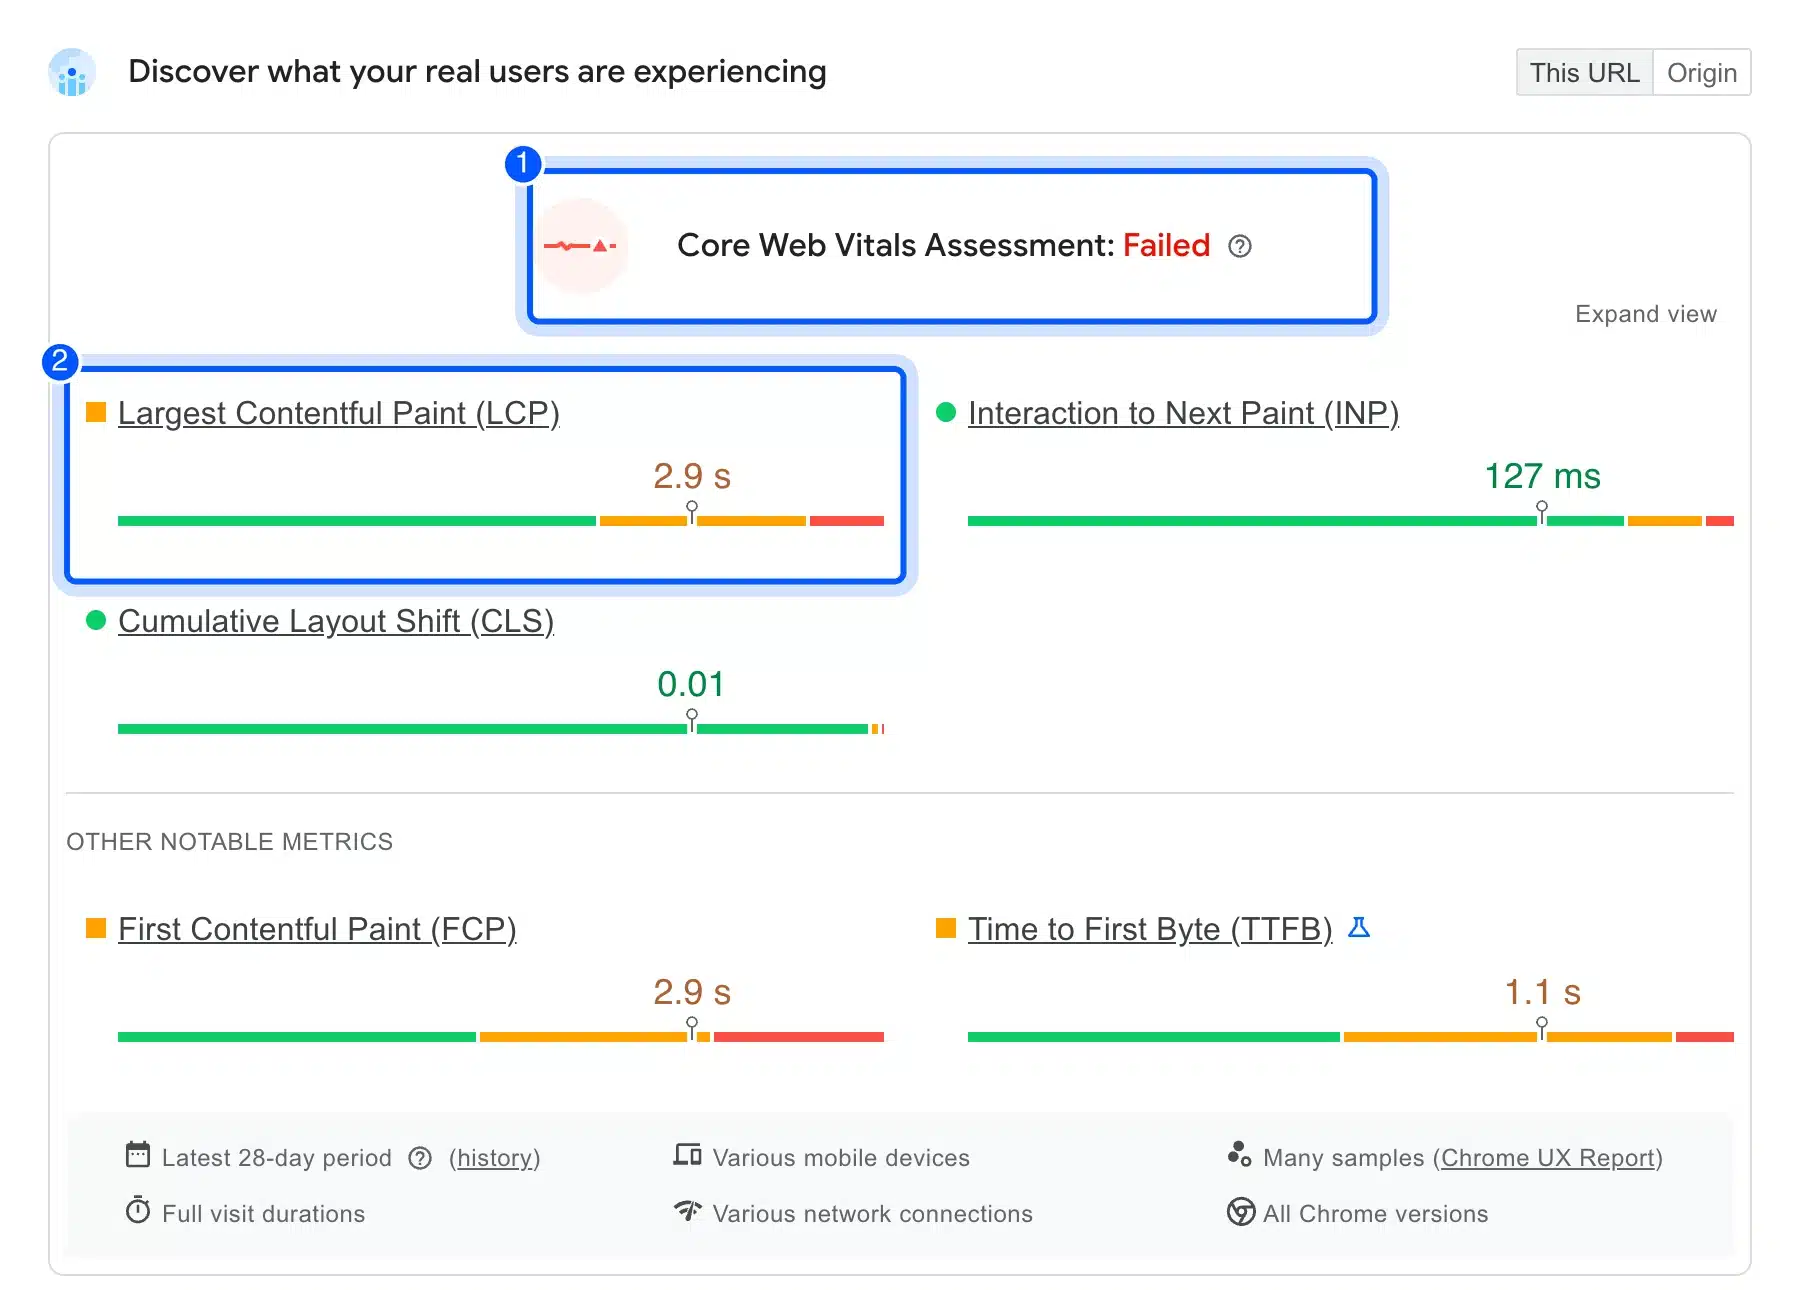
For comparison, we ran the same test on WordPress.org, which has plenty of traffic. Its mobile field data failed the assessment on LCP at 2.9 seconds, while INP sat at 127 ms and CLS at 0.01.
Step 2: Read the Lab Metrics
The lab section under “Diagnose performance issues” is one Lighthouse run on Google’s servers over slow 4G on an emulated Moto G Power. It reports LCP and CLS but never INP. Use it to find causes, and never treat it as your pass or fail result.
Scroll to Metrics. Our homepage showed LCP 2.0 s and CLS 0 in the lab, both in the green, plus a Speed Index of 4.0 s in orange.
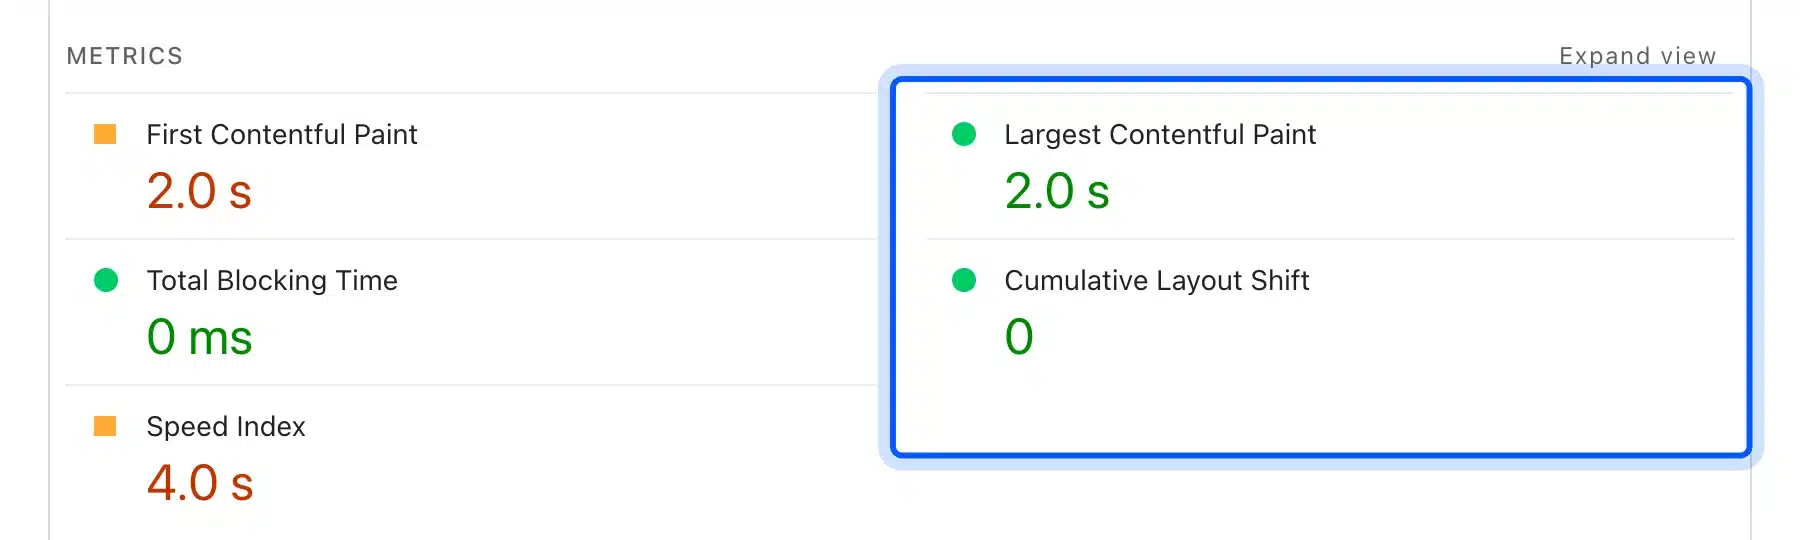
Total Blocking Time stands in for INP here. The web.dev guide says Lighthouse cannot measure INP and names TBT as the lab metric to watch. Under Insights, PSI listed “Render-blocking requests” with an estimated 1,330 ms saving on our homepage, which tells you where to start.
Step 3: Run Lighthouse in Chrome DevTools
Lighthouse is the same engine PageSpeed Insights uses, but it runs on your own computer. That makes it the right tool for testing a fix before it goes live. Open DevTools, pick the Lighthouse panel, choose Mobile, and click Analyze page load.
- Open DevTools: Right-click the page, choose Inspect, then open the Lighthouse tab.
- Pick Navigation and Mobile: Leave the Performance category on. The Lighthouse overview says a run takes 30 to 60 seconds.
- Click Analyze page load: Read the Metrics block, then the Insights list under it.
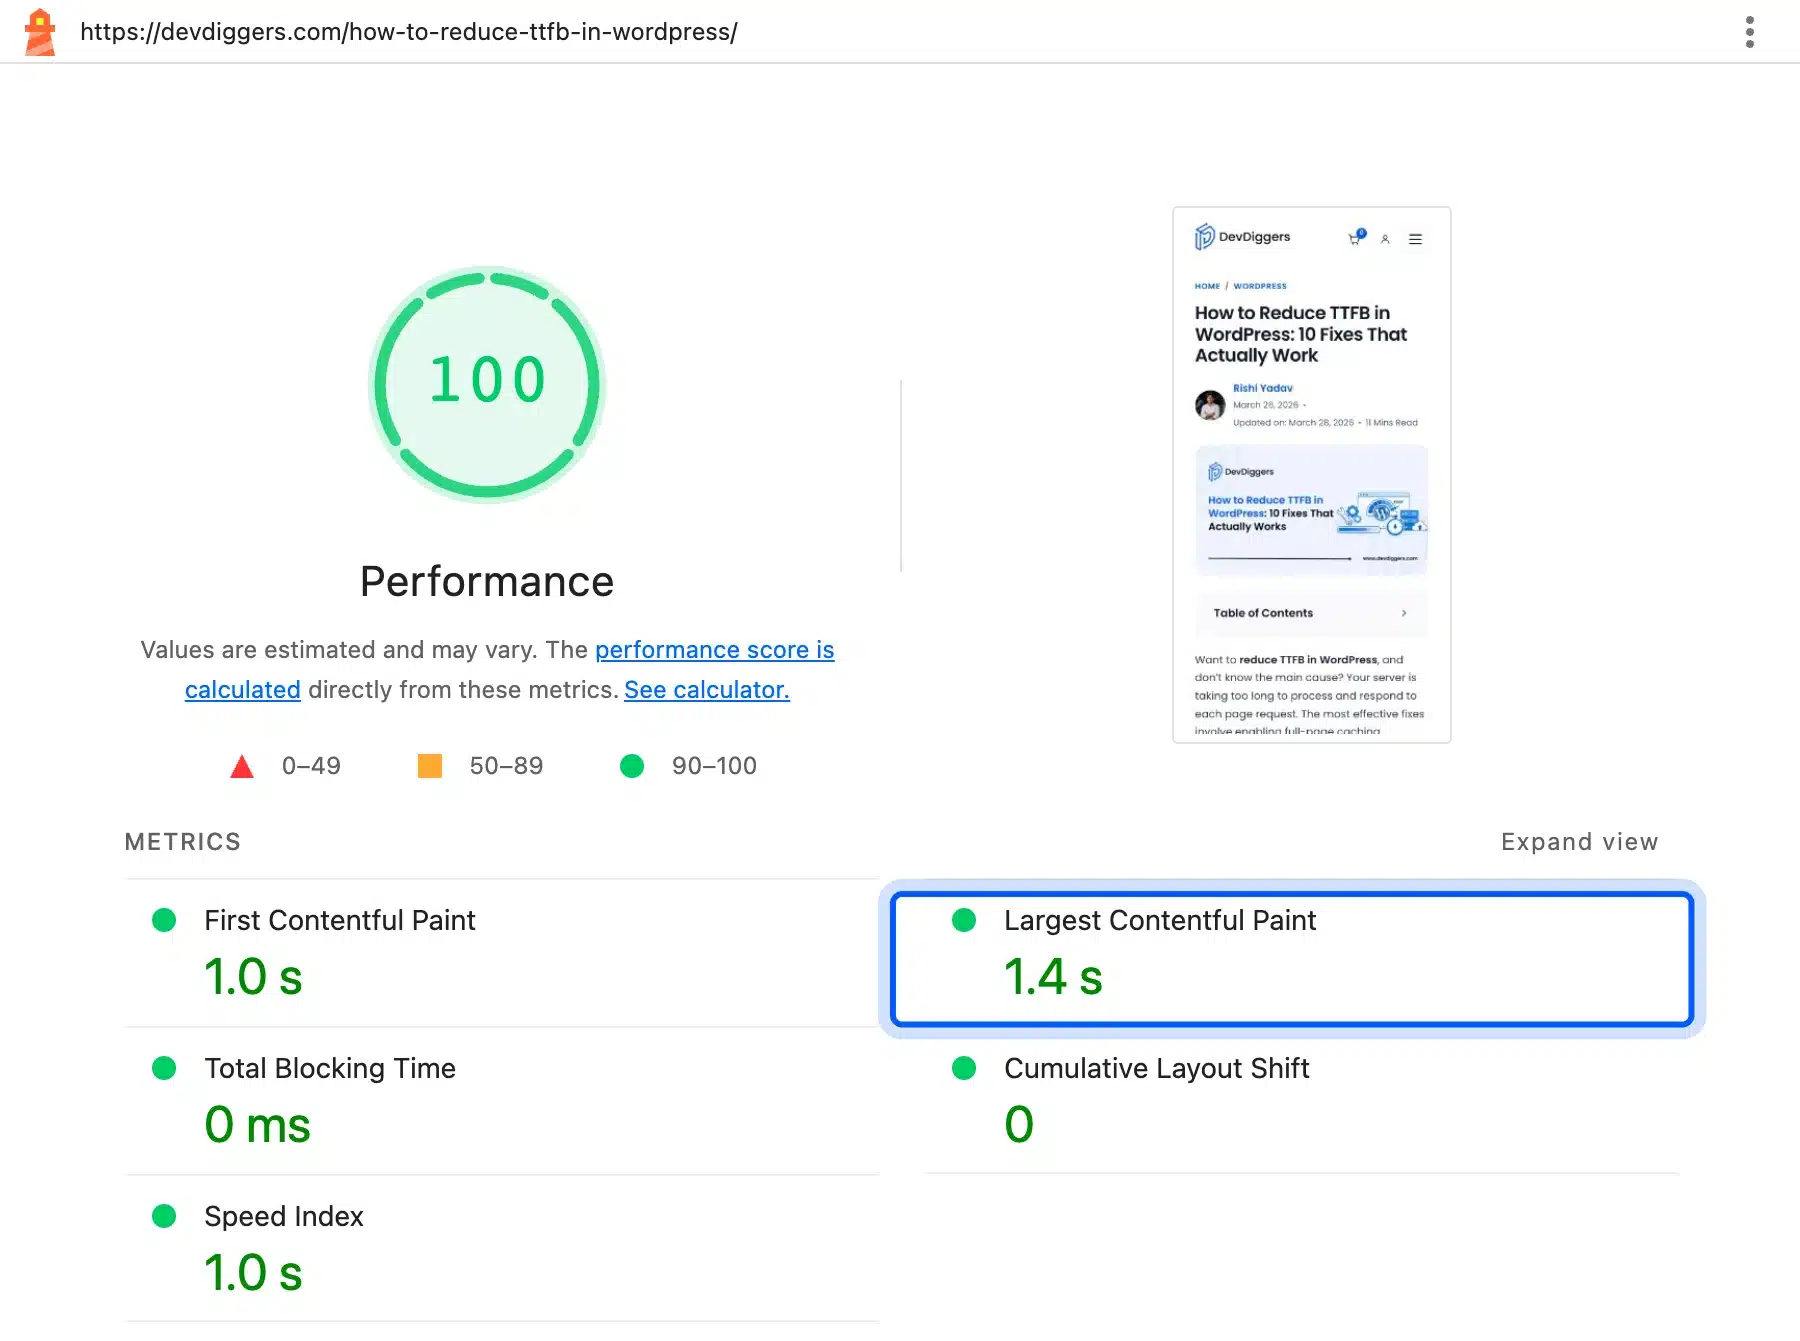
We ran Lighthouse 13.5 five times on the blog post and five times on the homepage. The post was steady at 1.37 s LCP every run. The homepage ranged from 1.37 s to 2.15 s, so one run alone would have told two different stories.
Tip: Run Lighthouse three to five times and take the middle result. Close other tabs first, since Lighthouse slows the CPU on purpose and anything else running adds noise.
Step 4: Check the Search Console Core Web Vitals Report
Search Console shows field data for your whole site, grouped by similar URLs, for mobile and desktop. Open the Core Web Vitals report under Experience, then open the mobile chart. It only lists URL groups with enough real Chrome traffic.
The Search Console Core Web Vitals report help says a URL group takes the status of its worst metric. So a group with good LCP and poor CLS shows as Poor. After a fix, click Start Tracking on the issue and Search Console watches the next 28 days of data.
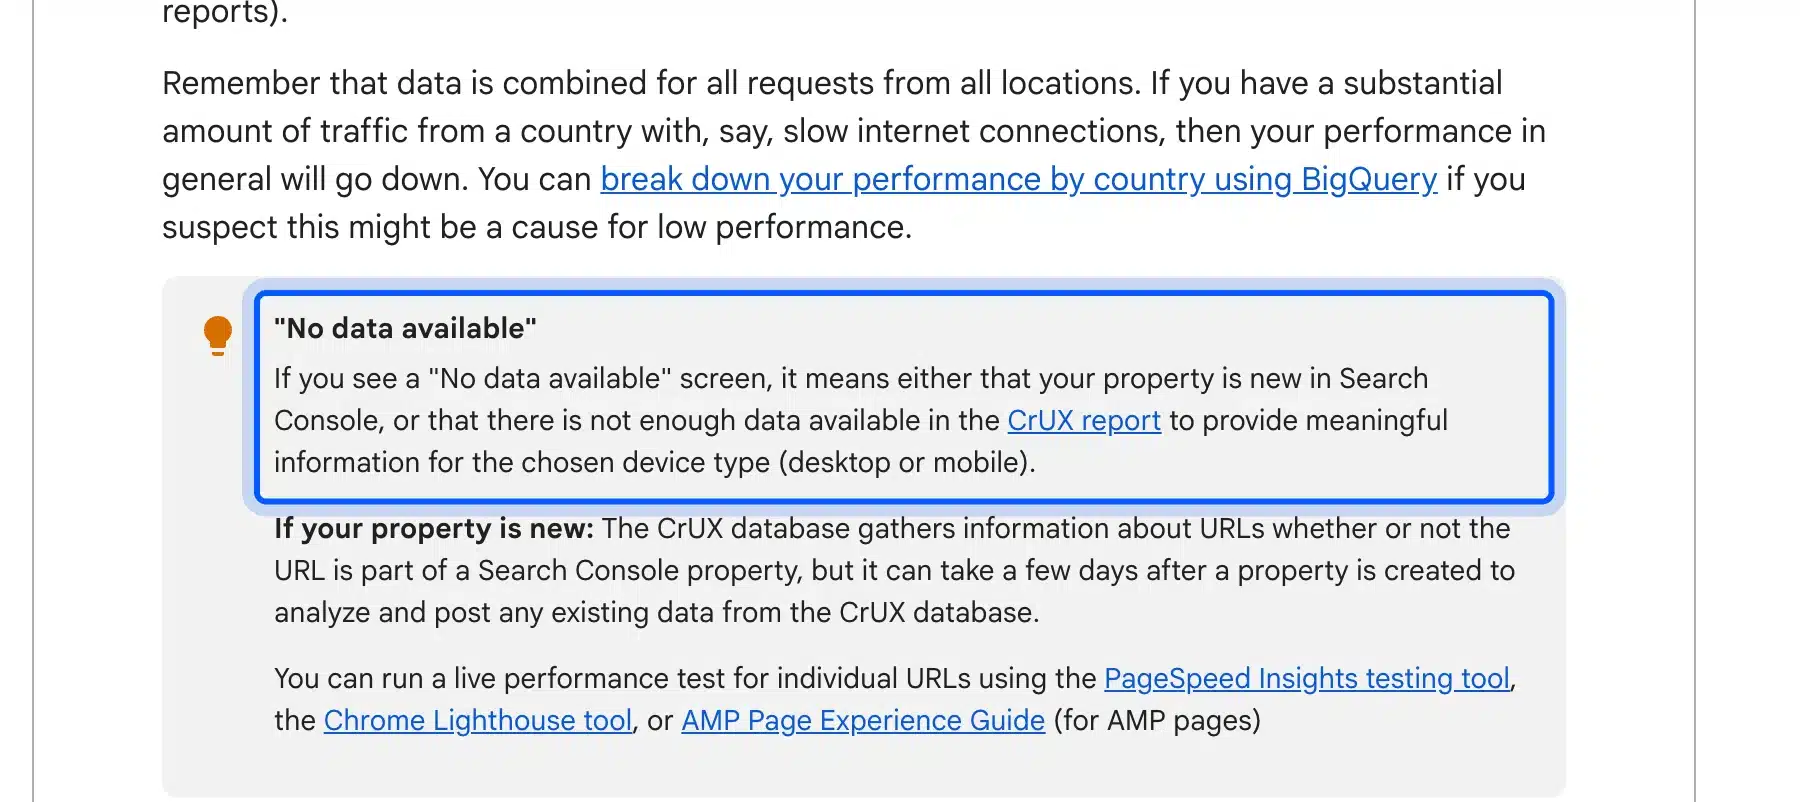
A small site often sees “No data available” here. The help page gives two reasons: a new property, or too little CrUX data for that device type. Our own site falls into the second group, which matches the empty field section in PageSpeed Insights.
Step 5: See the Trend in CrUX Vis
CrUX Vis is Google’s free viewer for Chrome UX Report history, and it needs no API key. Enter an origin, pick phones, and it charts LCP, INP and CLS week by week. Use it to see whether a slow page is a new problem or an old one.
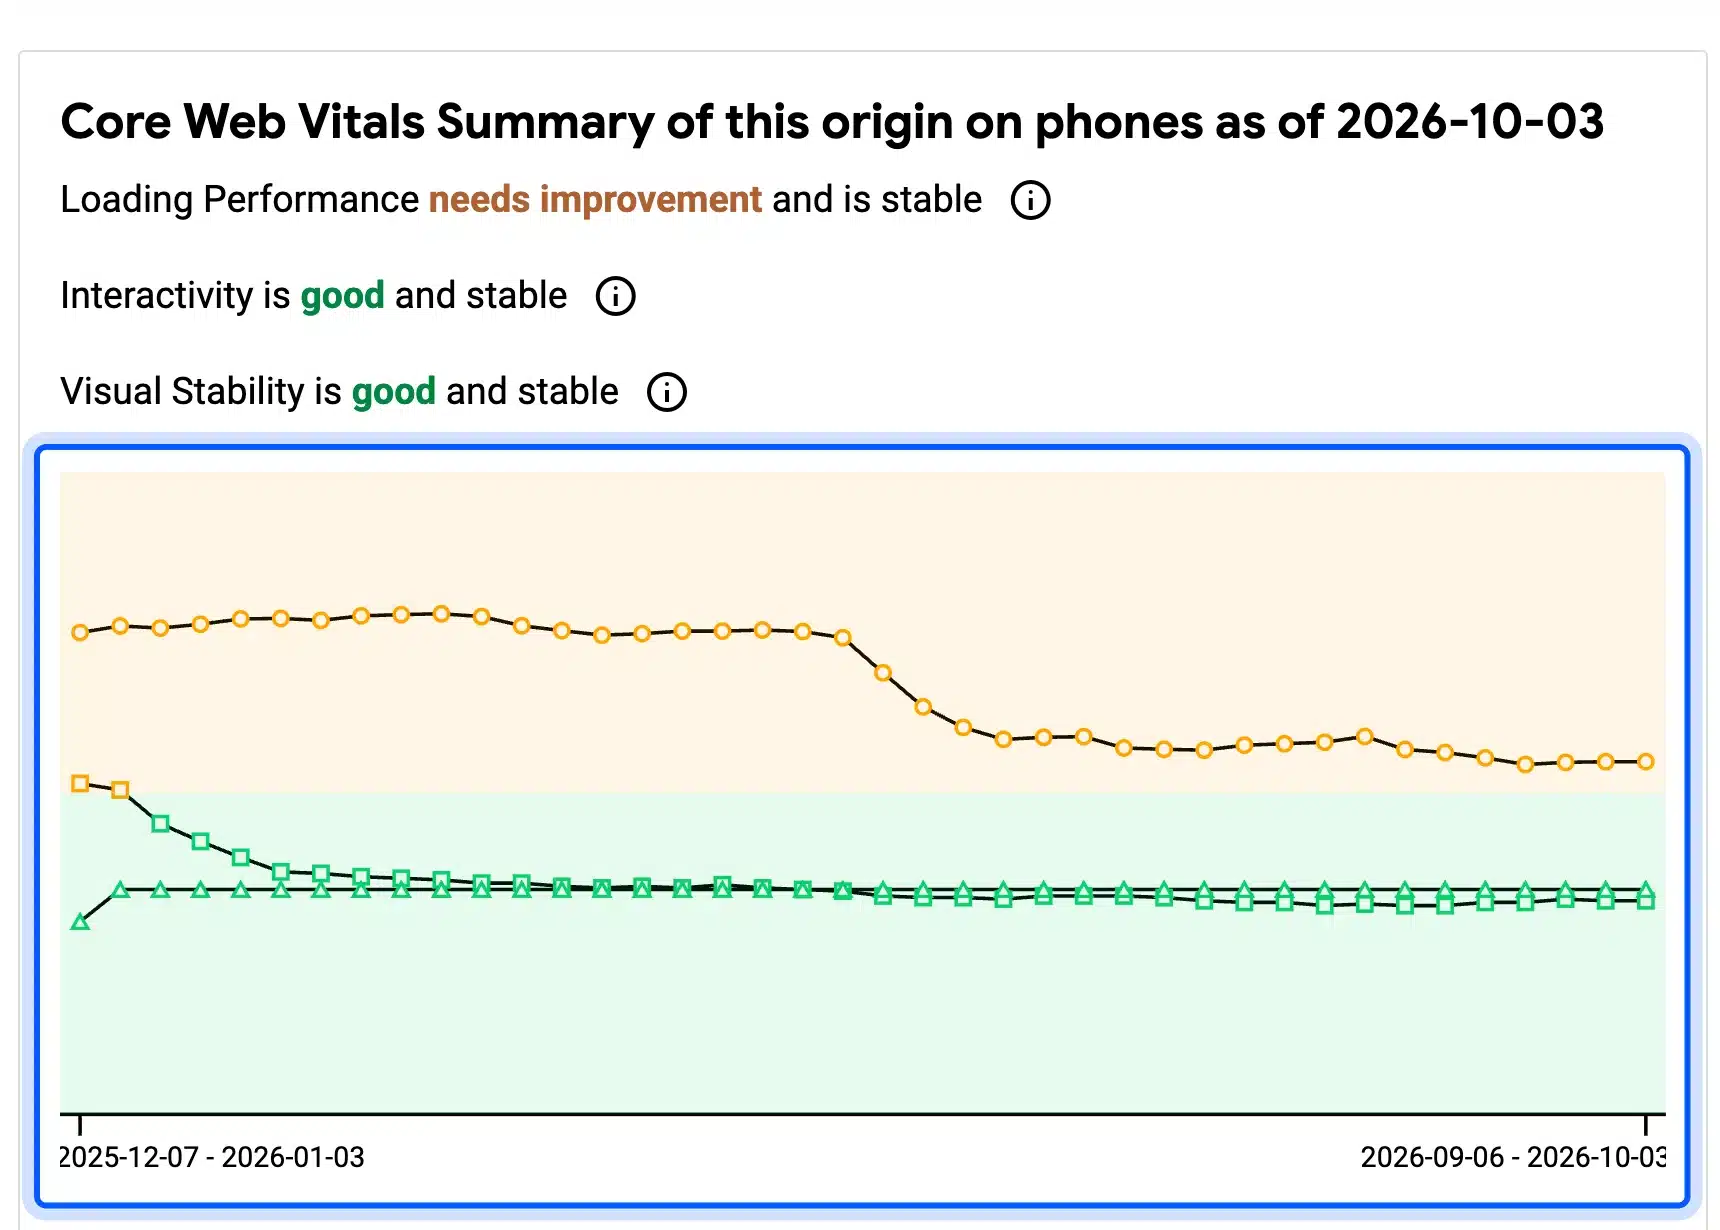
We loaded WordPress.org on phones in CrUX Vis. The summary dated 2026-10-03 said loading performance “needs improvement” while interactivity and visual stability were good. The LCP line dropped in spring 2026 and then held steady.
The same search for devdiggers.com returned “missing data” on all three metrics. The CrUX API gives the same data in JSON, updated daily around 04:00 UTC, but it needs a Google Cloud API key.
Step 6: Measure Real Visits With the web-vitals Library
The web-vitals JavaScript library from Google’s Chrome team measures LCP, INP and CLS inside real visitors’ browsers. It is the only free way to get INP on a site without CrUX data. Install it, log each metric, and send the values to your analytics.
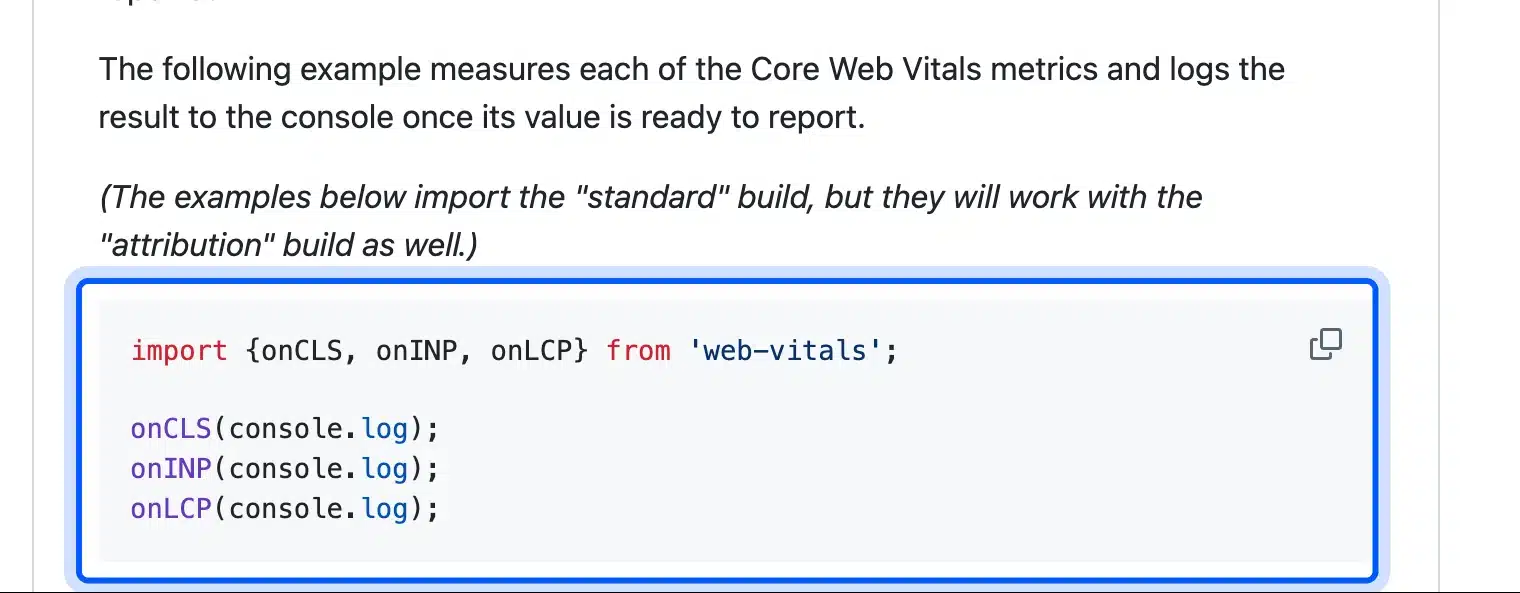
The web-vitals library on GitHub shows the basic setup in four lines:
import {onCLS, onINP, onLCP} from 'web-vitals';

onCLS(console.log);
onINP(console.log);
onLCP(console.log);
The attribution build also names the element behind each number. On our homepage it pointed INP at the menu toggle button and LCP at the hero heading. That is the detail you need to fix the right thing.
Running all six tools takes time on every release. If your store needs this done and fixed for you, our WordPress speed optimization services cover the testing and the fixes.
Lab Data vs Field Data in Core Web Vitals Testing
Lab data is one simulated visit on fixed hardware, while field data is the 75th percentile of real Chrome visits over 28 days. Core Web Vitals testing only passes or fails on field data. Lab data exists to find the cause and to check a fix before real users see it.
The WordPress.org test shows the gap in one screen. Its lab LCP was 6.1 seconds, red and far past the limit. Its field LCP from real visitors was 2.9 seconds, still failing but less than half the lab number.
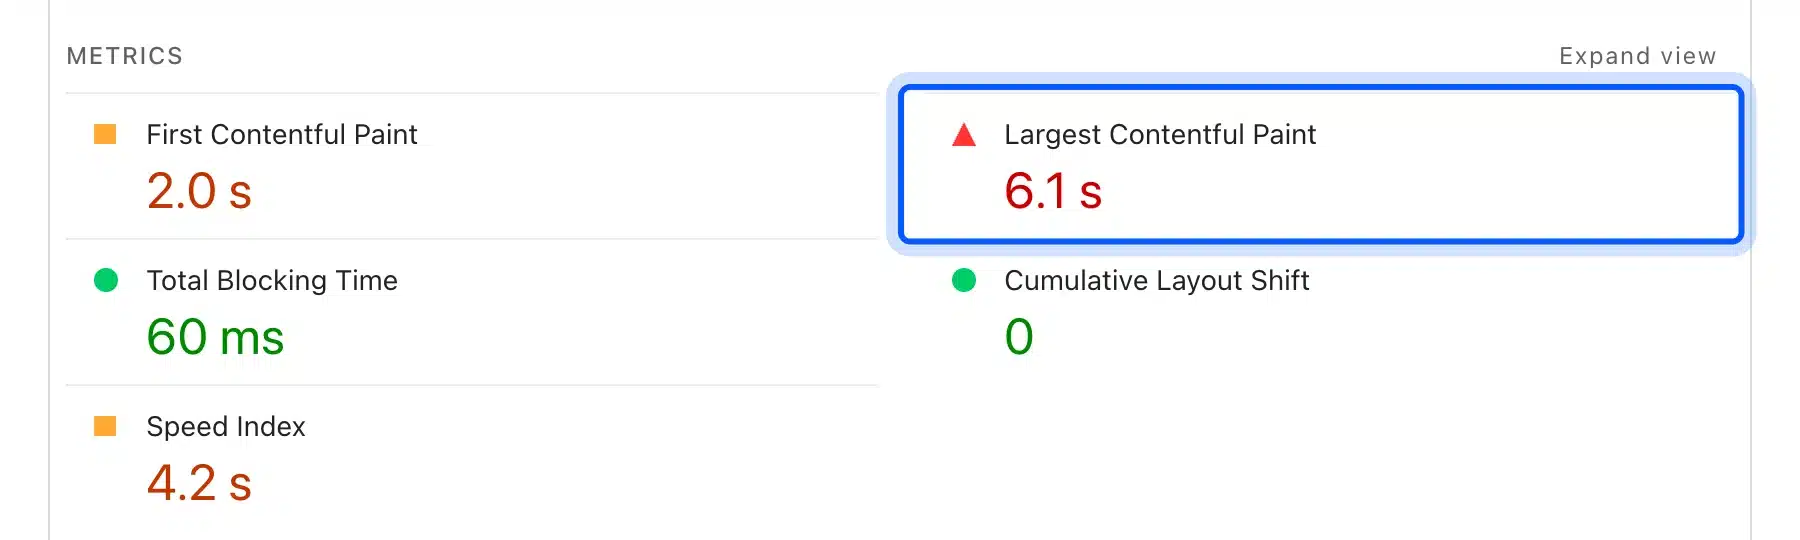
The lab result is slower because PSI throttles the network to slow 4G and the CPU to a mid-range phone. Many real visitors have faster phones and warm caches. A slow lab result still points at real problems, but it does not predict your field score.
Timing matters as well. Field data is a 28-day average, so a fix you shipped last week shows up only partly. Lab data reflects the code as it is right now.
The gap can run the other way too. Lighthouse loads the page and stops, so it never taps a menu or opens a dropdown. Anything that breaks after the first interaction is invisible to it.
What We Found Testing devdiggers.com
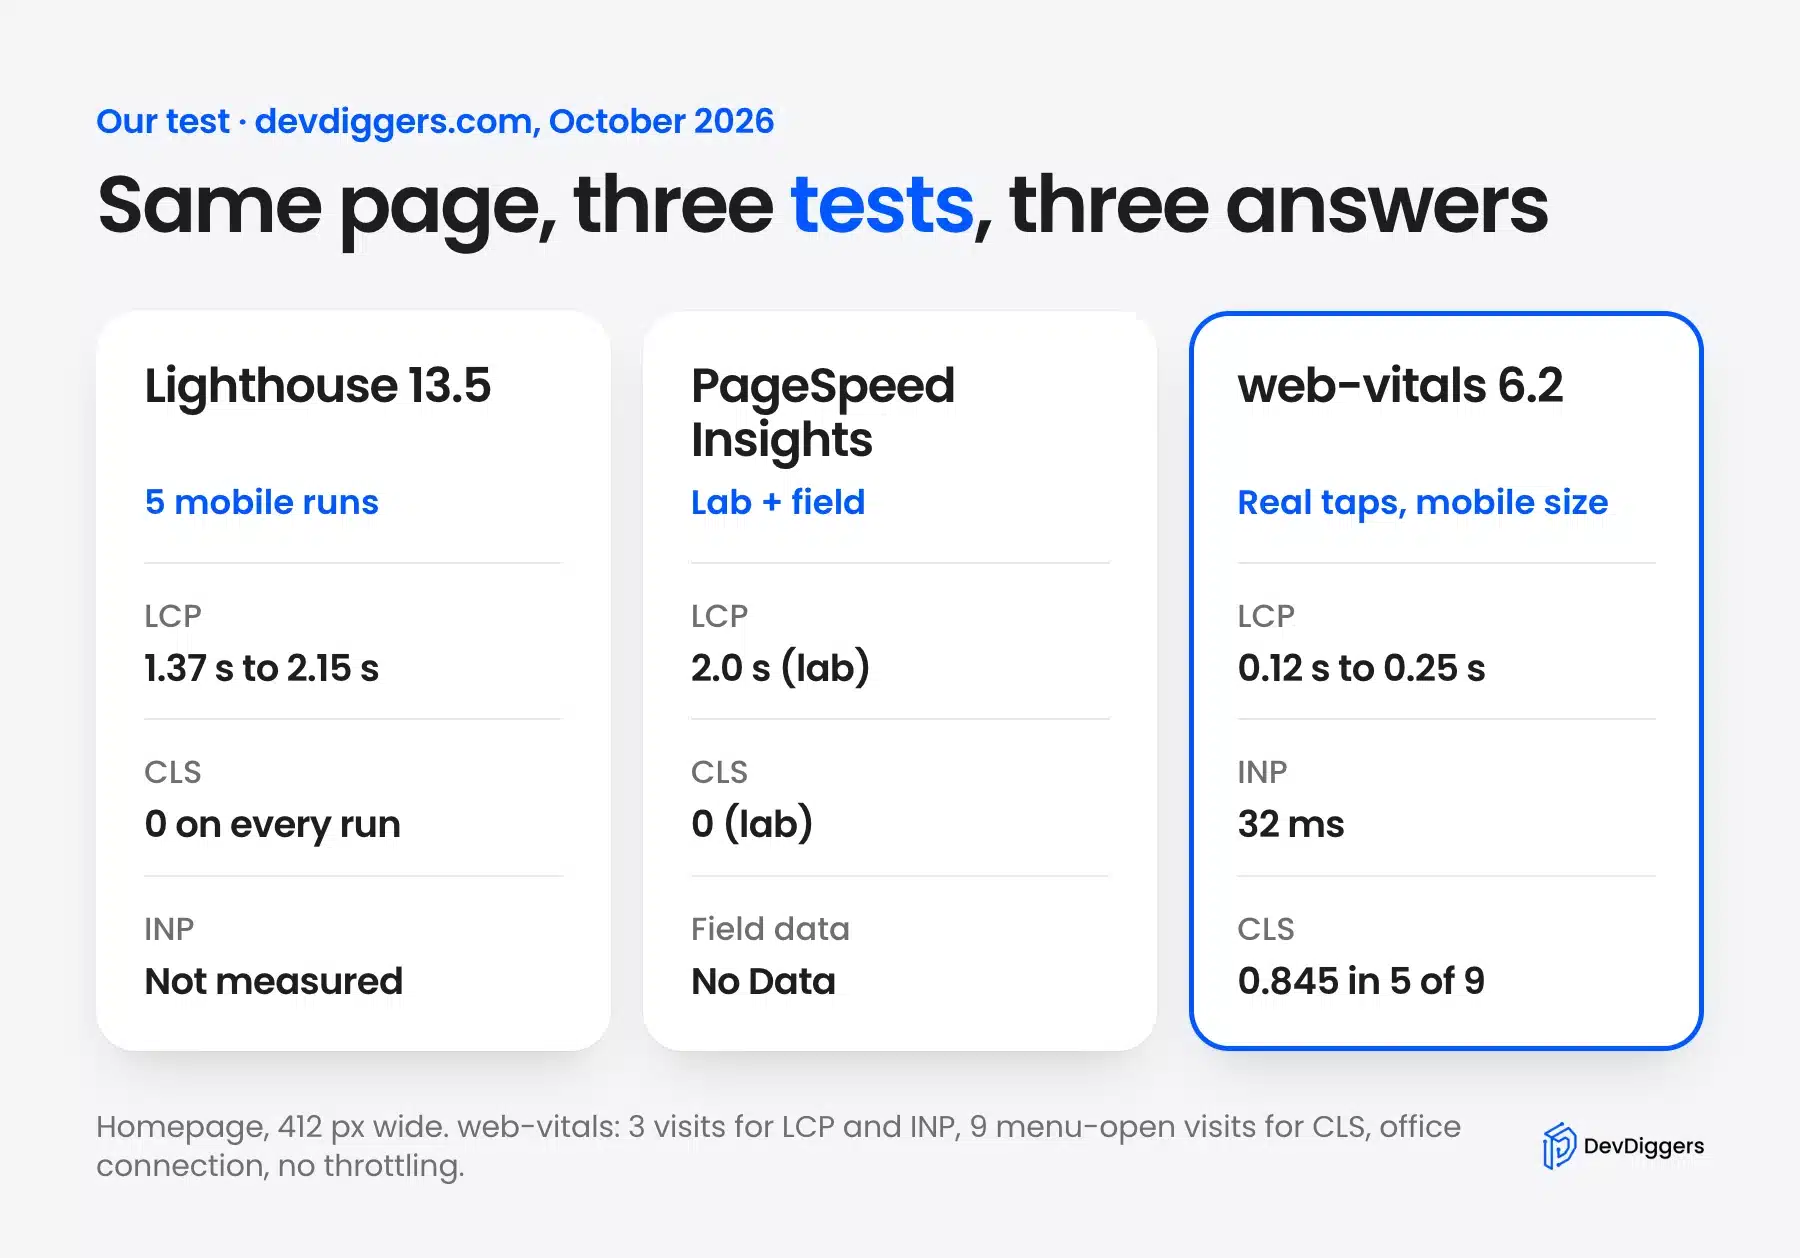
Our three tests disagreed on the same homepage in October 2026. Lighthouse gave CLS 0 on all ten runs and PageSpeed Insights agreed. The web-vitals library, with real taps on a 412 pixel screen, logged CLS 0.845 in 5 of 9 visits after opening the mobile menu.
The shift came from the main content area moving when the menu drawer opened, about 780 ms after the tap in the run we timed. The CLS guide on web.dev excludes shifts within 500 ms of an input, so a later shift counts against the page. On the blog post, collapsing the table of contents produced CLS 0.245 the same way.
That is a real bug on our own theme, and no load-only test could have found it. INP was a healthy 32 ms on every tap, and web-vitals LCP was 0.12 to 0.25 seconds on our unthrottled office connection.
The usual fix is a menu drawer that opens as an overlay and leaves the main content in place. A table of contents can animate inside a box with a fixed height.
Worth knowing: A web-vitals number from your own computer is one visit. It tells you a problem exists. Only Search Console or CrUX tell you how many real visitors hit it.
How to Read and Fix Each Score
Read each Core Web Vitals score against its three bands: good, needs improvement and poor. Fix the metric in the worst band first, because Search Console labels a whole URL group by its weakest metric. Then retest in Lighthouse and wait 28 days for field data to confirm.
Search Console uses these bands for every URL group:
Each metric has its usual causes and fixes:
- Slow LCP: Look at server response time first, then render-blocking CSS and the hero image size. Our guide to reducing TTFB in WordPress covers the server side, and WordPress image optimization covers the hero image.
- Slow INP: Find long JavaScript tasks that run when someone taps. Break them up, defer third-party scripts, and drop plugins that add work to every click.
- High CLS: Give every image, ad slot and embed a fixed width and height. Then test menus and accordions by hand, since our own CLS only appeared after a tap.
If the lab numbers are slow across the board, caching is usually the cheapest win. Our list of the best WordPress caching plugins compares the main options. When the whole site feels sluggish, start with how to fix slow website loading and the common causes in why WordPress is so slow.
Free Core Web Vitals Checker Tools Compared
The best free Core Web Vitals checker depends on the question you are asking. PageSpeed Insights answers whether one URL passes, and Search Console shows which page groups fail. Lighthouse checks a fix before release, and web-vitals measures INP without CrUX data.
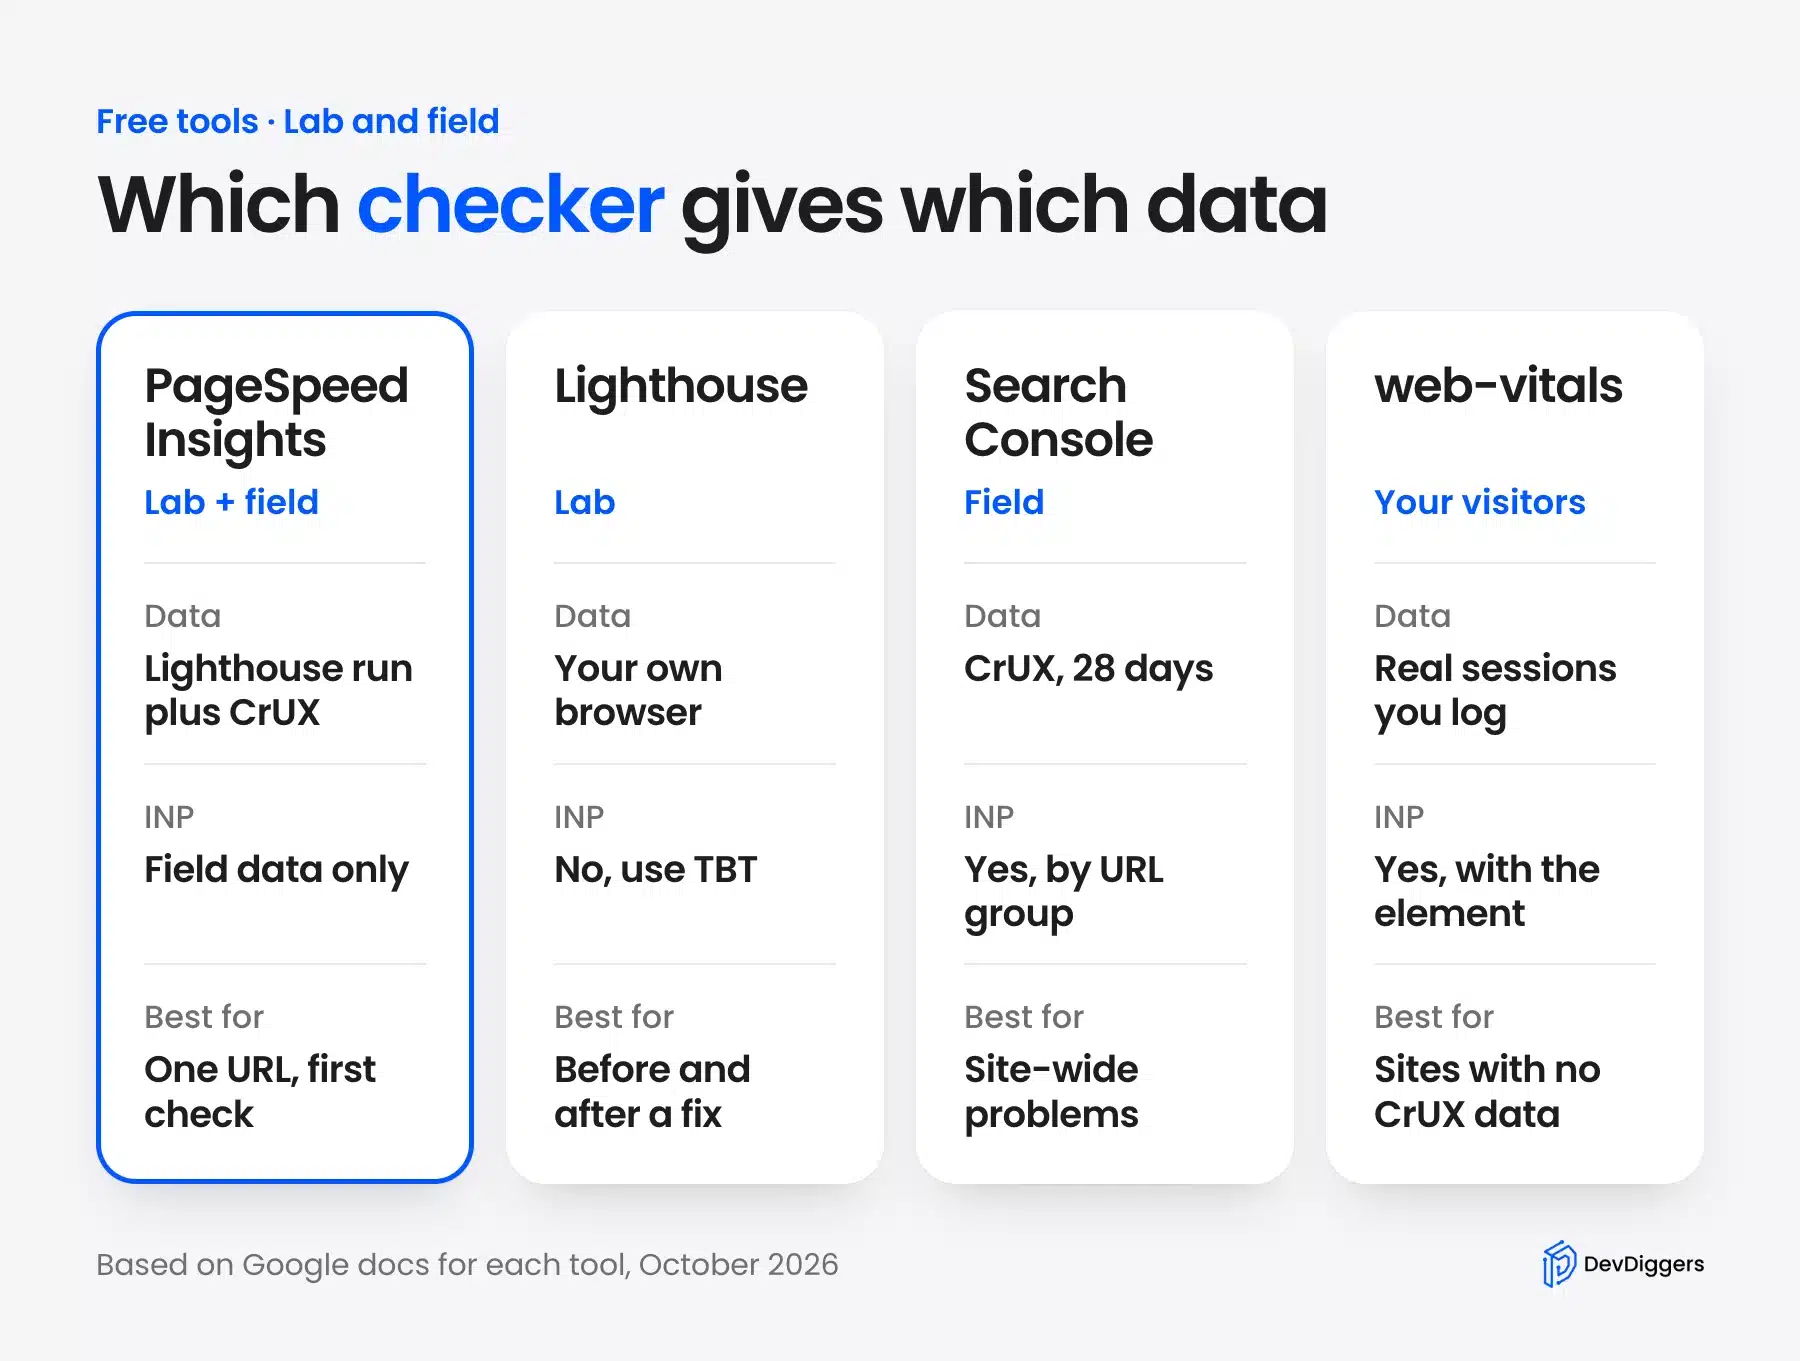
Pick by the question in front of you. A store owner checking a new theme wants PageSpeed Insights on three page types: home, product and checkout. A developer testing a code change wants Lighthouse before and after, run five times each.
A site owner asking “is the whole site fine?” wants Search Console, because it groups thousands of URLs by template. That view shows a broken product template once, where PageSpeed Insights would need a test on every product.
Third-party checkers mostly read the same two sources. They either run Lighthouse or query CrUX, so they cannot show field data that Google does not have. On a low-traffic site, the only new data comes from logging your own visitors with web-vitals.
Note: A performance score of 100 is a lab grade. Our blog post scored 100 in Lighthouse and still had a CLS problem after a tap. Read the metrics before the score.
Conclusion
A Core Web Vitals test is only finished when you have read the field data. PageSpeed Insights and Search Console give you that verdict, and Lighthouse helps you find and check the fix. The web-vitals library fills the gap when Google has no data for your site.
Our own test showed why one tool is not enough: two lab tools said CLS 0, and a real tap found 0.845. Run the lab tools on every change, test menus and accordions by hand, and check Search Console a month after each fix.
Frequently Asked Questions (FAQs)
Q1. Are Core Web Vitals a ranking factor?
Google’s Core Web Vitals page in Search Central says good scores align with what its core ranking systems seek to reward. They are one page experience signal among many. Relevant content still matters more than a perfect score.
Q2. How long does it take for Core Web Vitals to update after a fix?
Field data covers a rolling 28-day window, so a fix takes up to four weeks to show fully. Lighthouse shows the change at once. In Search Console, Start Tracking on an issue watches the next 28 days.
Q3. Why does my PageSpeed Insights score change every time I run it?
Each lab run depends on server load, network timing and the test machine. Our homepage LCP moved between 1.37 and 2.15 seconds across five Lighthouse runs with the same settings. Take the median of three to five runs.
Q4. What replaced First Input Delay in Core Web Vitals?
Interaction to Next Paint replaced First Input Delay in March 2024. INP measures every interaction during a visit, where FID only timed the first one. A good INP is 200 milliseconds or less.
Q5. Is a PageSpeed score of 100 the same as passing Core Web Vitals?
No. The score comes from one lab run and leaves out INP. Passing depends on field data for LCP, INP and CLS at the 75th percentile of real visits.
Q6. Should I test mobile and desktop separately?
Yes. PageSpeed Insights and Search Console report each device on its own, and mobile usually fails first. A page can pass on desktop and fail on mobile with the same code.